QCM-D-measurement-sensor

QCM-D Measurement

Quartz Crystal Microbalance with Dissipation monitoring (QCM-D) is a real-time, surface sensitive technique for analyzing surface-interaction phenomena, thin film formation and layer properties.

Areas covered in this article

What is QCM-D?

Quartz Crystal Microbalance, QCM, and extended versions, such as Quartz Crystal Microbalance with Dissipation monitoring, QCM-D, are surface sensitive, real-time technologies that detect mass changes at the sensor surface with nanoscale resolution. Essentially, these instruments are balances for very small masses and the molecule-surface interactions are detected as changes in mass, i.e. mass uptake or mass loss, as molecules adsorb or desorb.

In addition to the changes in mass, QCM-D also captures changes in energy loss. This additional information provides insight into the viscoelastic properties of the system under study and can reveal structure as well as structural changes, such as swelling, crosslinking and collapse, of the molecular layer at the sensor surface.

QSense Mass

Overview  Working principles of QCM and QCM-D technology  Download


QCM history in brief

In the early days, QCM-technology was used to monitor thin-film deposition in gas phase and vacuum environments. A couple of decades later, it was introduced to usage also in liquid phase. This opened for surface interaction analysis of, for example, biomolecules and polymers, which typically form soft, and/or thick layers at the sensor surface. In this type of measurements, extended QCM:s, that measure the energy loss, have proven to be particularly useful since information about the energy loss helps the analysis and quantification of viscoelastic layers.

Measuring the mass

In order to go from the detected frequency change, Δf, to a quantified number in mass units, a conversion is needed. The relation between frequency and mass was first identified by Günther Sauerbrey in 1959 and resulted in the so-called Sauerbrey relation. The discovery resulted in the birth of the QCM-technology.

Quantification of soft layers

For viscoelastic modelling to be possible, or even to know whether it is in fact needed, we need information about the energy losses in the system, the so-called dissipation. The energy loss is captured with extended QCM:s such as QCM-D. I.e., in contrast to standard QCM, that captures one parameter, Δf, as a function of time, QCM-D technology captures two parameters, Δf and ΔD, as a function of time.

Related products

   QSense Pro Looking for a companion in large-scale QCM-D analysis? The fully automated  QSense Pro is best fit for the job.
   QSense Explorer Discover the many possibilities of our most versatile and modular QCM-D  instrument.
   QSense Analyzer Both fast and flexible, QSense Analyzer enables you to compare several samples  at the same time.

How does QCM-D work?

The QCM is an acoustic technology, i.e. it measures changes of sound. The sound is typically in the MHz regime, however, and not detectable by the human ear.

The core of the technology is the oscillating unit - a thin quartz crystal disk, which has electrodes deposited on each side. Via an applied voltage, the crystal can be excited to resonance, and the resonance frequency is related to the thickness (mass) of the disk. If the thickness changes, so will the resonance frequency, f. By monitoring changes of the resonance frequency, Δf, it is possible to detect small changes of the crystal thickness (mass). The measurement makes it possible to detect nanoscale mass changes such as adsorption or binding of molecules to the surface, which will be detected as mass increase, whereas mass decrease will indicate mass removal, for example via molecular desorption or etching of the surface.

In addition to measuring Δf, which is measured by all QCM.:s, QCM-D measures an additional parameter, the dissipation, ΔD. The dissipation gives information about the energy losses in the system and are particularly useful in the study of soft layers, where this information is used for quantification of the layer properties.

QCM-D single harmonic

Piezoelectricity - a key phenomenon for QCM-technology

As mentioned above, the core of QCM technology is the sensor which reveals mass changes via changes of its resonance frequency. A key quality of the sensor for this excitation to be possible is that it is made of a piezoelectric material. Piezoelectricity is a phenomenon that couples the electrical and the mechanical state of a material. This means that when the material is mechanically deformed, its faces will be charged, and vice versa - i.e. when the material is exerted to an electric field, the material will be deformed. Typically, QCM sensors are made of quartz, but other piezoelectric materials could be used as well.

Piezoelectric principle

Overview  What is Piezoelectricity and how does it work?  Download

The Sauerbrey equation - converting frequency change to mass change

The relation between frequency and mass, which enables the detection of molecule-surface interactions, was first identified by Günther Sauerbrey in 1959 and resulted in the so-called Sauerbrey relation.

The equation states that there is a linear relation between frequency change and mass change according to

The Sauerbrey equation-1

where C, the so-called mass sensitivity constant, is a constant related to the properties of quartz and n=1, 3, 5… is the number of the harmonic used.

For the Sauerbrey equation to be valid, the layer on the sensor must be thin, rigid and firmly attached to the crystal surface. When hydrated systems are studied, for example polymers or biomolecules in liquid, the conditions are often not fulfilled and Sauerbrey relation will underestimate the mass. In this situation, there are other ways to quantify the layer properties, for example via so-called viscoelastic modelling.

Overview  The Sauerbrey relation  Download

The Dissipation - enabling analysis of viscoelastic layers

QCM-D measures changes of both frequency, f, and dissipation, D. The D-value gives information about the energy loss in the system, and reveals how soft, or viscoelastic the layer at the surface is. This means that the D-value will reveal whether the layer is rigid, and if the Sauerbrey equation can be used for the quantification or not. In situations where the Sauerbrey equation cannot be used, the D-value contributes with valuable information to be used as input in the quantification model and to extract mass, thickness and viscoelastic properties.

Overview  What is Dissipation and why is it important?  Download

QCM sensitivity

A parameter that is often discussed in the context of QCM is the mass sensitivity, C, in the Sauerbrey equation, (eq 1). This constant, which is often referred to as the ‘sensitivity’, says how many ng of material per cm2 of the sensor that is needed to shift the resonance frequency 1 Hz, i.e. the smaller the C, the higher the mass sensitivity. The value depends purely on the fundamental resonant frequency of the crystal, and is defined as

QCM mass sensitivity

where υq is the shear wave velocity in quartz, ρq is the density of the quartz plate, and f0 is the fundamental resonant frequency. It is noted in eq. 2 that the higher the fundamental mode, the higher the theoretical mass sensitivity. As an example, the theoretical mass sensitivity of a 5MHz crystal is 17.7 ng/(cm2∙Hz) and that of a 10MHz crystal is  and 4.4 ng/(cm2∙Hz).

Guide  How to read a QCM specification  Download

The importance of the overtones

QCM is an acoustic technology, and like an acoustic instrument, the QCM crystal can be excited to resonate at several different harmonics, n. For AT-cut QCM crystals, which oscillate in the thickness shear mode, only the odd harmonics, n = 1, 3, 5,…. are possible to excite. The lowest resonance frequency, n = 1, is called the fundamental, and n = 3, 5, 7 etc are overtones to the fundamental. As an example, if the fundamental frequency is 5HMz, then available overtone resonances would be 15 MHz, 25 MHz, 35 MHz etc.

Each harmonic measured will contribute with unique information about the system under study and be useful when interpreting the QCM data. Additionally, information from multiple overtones is also key when performing viscoelastic modeling - the model contains several unknown parameters, and at least the same number of measured variables are needed to feed into the model.

When is QCM-D used?

QCM-D technology is used in academic as well as in industrial settings to get answers throughout the research process. The nature of the technology makes it useful in a vast range of areas - areas where molecule-surface interactions play an important role.

Depending on the focus of the research, and of course the phase of the project, QCM-D technology is used to answer different types of questions.

Explore-characterize-optimize

A. Explore – map out the system behavior to increase your understanding

QCM-D technology is used in basic research and other projects of similar character to help answer fundamental questions such as "What happens when/if..?" and "How does this molecule interact with the surface at these conditions?" Examples of questions that QCM-D are used to answer are:

    • What happens if I change the lipid mixture - will a bilayer form?
    • Will the protein bind to this functionalized surface at this pH?
    • At what temperature will the polymer brush go from swollen to collapsed state?

B. Characterize or verify the surface interaction processes, or system behavior

If the work is more applied, QCM-D technology can be used to verify a certain surface-interaction behavior. For example, it could be used to:

    • Verify bilayer formation
    • Double-check that the protein is binding to the functionalized surface
    • Verify polymer brush swelling/collapse transition at known T

C. Optimize - Identify optimum performance as a function of the parameter(s)

If the project is in a development phase, it could be relevant to tweak parameters, conditions and settings to identify the optimum performance or to obtain a certain surface interaction behavior. In this situation, QCM-D can help answer questions such as:

    • What is the optimal lipid-ratio for a bilayer to form?
    • At which pH will I get the fastest protein uptake?
    • Which polymer-chain configuration should I use to get a phase transition at this T?

Molecular size range and film thicknesses

QSense QCM-D measures at the nanoscale, and the detection range is ~1 Å to 1 um, depending on the layer properties.

Typical molecules and entities that are studied are biomolecules, surfactants, polymers, nanoparticles, cells and other structures in the same size range.

Length scale

Vary the conditions

Most surface interaction processes depend on the context such as surface chemistry and the ambient solvent conditions. To get an understanding of the system under study it is important to mimic these real-life conditions. 

QSense QCM-D technology allows you vary key parameters such as:

    • Surface material
    • Sample concentration
    • Temperature
    • Solvent
    • pH
    • Ionic strength

Examples of application areas

For decades, QCM technology has been used to monitor thin-film deposition in vacuum and gas phase. When it was discovered that QCM could also be used for measurements in liquid phase in the 80’s, the number of possible applications increased significantly. Today, QCM, and extended versions, such as QCM-D, are used in a broad range of areas where surface interaction processes need to be explored and controlled. Examples include the areas of biomaterials, nanotoxicology, cleaning products and detergents, oil and gas, and CMP.

QCM-D-applications

Information you can extract with QCM-D

QSense QCM-D monitors molecule-surface interactions as well as properties of the layer formed at the sensor surface. The collected data enables characterization of the system under study, and questions that can be answered are for example:

    • is there is a molecule-surface interaction taking place or not?
    • how much material adsorbs/desorbs or binds? 
    • how fast is the process?

Mass, thickness and viscoelastic properties

The collected f and D at multiple harmonics allow for both qualitative information, such as revealing whether a molecule-surface interaction is taking place or not, as well as quantitative information on mass, thickness, and viscoelastic properties of the formed layer. This makes it possible to study molecular adsorption, desorption and binding as well as layer degradation and etching.

Time-resolved data

The information is time resolved, which not only allows for characterization of the formed layer, but also makes it possible to follow dynamic processes such as film formation, film degradation and structural rearrangements.

Hydrated mass, conformation and conformational changes

When molecules adsorb or bind to the surface, the surrounding solvent will couple to the molecules as an additional dynamic mass via direct hydration and/or entrapment within the adsorbed film. The mass sensed by QCM:s, includes both the mass of the mole­cules at the surface and the mass of the associated solvent. Therefore, it is often referred to as “hydrated mass”.

The amount of coupled solvent depends on how the molecules are arranged at the surface. For example, molecules in an elongated conformation, stretching out from the surface, will typically couple more solvent than if the molecules would be arranged in a tightly packed manner along the surface. If the molecular arrangement changes, there will be a mass change reflecting the amount of coupled solvent. As this mass change will be detected by the QCM, it is possible to detect and monitor conformational changes of the molecular layer, such a swelling, crosslinking and collapse.

Asset 1@4x

Adsorption/desorption

Asset 2@4x

Binding and interactions

Asset 4@4x

Cross-linking

Asset 5@4x

Swelling/collapse

Asset 3@4x

Degrading and etching

Overview  Information obtained with QSense QCM-D  Download

Examples of how QCM-D data can be used in different areas

Here we show examples of what information QCM-D can provide in the three different areas i) lipid-based research, research that includes ii) biomolecule-surface interactions and iii) polymer-based research.

i) QCM-D in lipid-based research

QCM-D has been used for about two decades to analyze and characterize lipid-based systems. Thanks to the time-resolved information on hydrated mass and layer softness, it is an unsurpassed technology in this area, where it enables monitoring of interaction dynamics between lipids and the solid support.

QCM-D allows you to:

    • Study lipid-surface interaction dynamics
    • Tell the difference between structures, such as
      • Monolayers
      • Bilayers
      • Vesicles
    • Study molecular/particle interaction with lipid-based systems

Analyze lipid-based systems with QCM-D

In practice, this means that QCM-D can be used to:

    • Analyze lipid - solid surface interaction dynamics, e. g. adsorption rate and adsorbed amount
    • Reveal the structure of the lipid system, e.g. intact vesicles, monolayers and bilayers
    • Detect structural rearrangements, e.g. vesicle rupture and fusion
    • Evaluate lipid membrane quality
    • Quantify the layer thickness
    • Quantify the mechanical properties of the layer
    • Analyze molecular interaction with the lipid-membrane

Overview  Characterization of model membranes with QSense QCM-D  Download

Analyze biomolecule surface interactions with QCM-D

As for the lipids-based systems, QCM-D has been used since the beginning of this millenium to analyze biomolecular-based systems.

Thanks to the time-resolved information on hydrated mass and layer softness, the technology enables monitoring of interaction dynamics between the biomolecule and the surface. For example, you can monitor and characterize events such as:

    • Adsorption/desorption
    • Binding
    • Enzymatic action/reactions
    • Conformational and structural changes
    • Fibril formation (not shown in fig)

Analyze biomolecular interactions with QCM-D

In practice, this means that QCM-D can be used to:

    • Analyze biomolecule - surface interaction dynamics, e.g.

      • adsorption/desorption/binding rates
      • adsorbed/desorbed/bound amount

    • Detect structural arrangement and rearrangement
    • Quantify the layer thickness
    • Quantify the mechanical properties of the layer

Overview  Characterization of biomolecular interactions with QSense  Download

QCM-D in polymer-based research

Thanks to the time-resolved information on hydrated mass and layer softness, QCM-D is particularly good at analyzing highly hydrated systems (structures) and systems where the  degree of hydration changes over time.

For example, you can monitor and characterize events such as:

    • Polymer grafting
    • Buildup of PEMs
    • Conformational changes, swelling, collapse and crosslinking
    • Molecular interactions with polymer layers

Particularly, it is important to note that thes processes can be analzyed as a function of molecular and ambient conditions such as:

    • Molecule structure
    • Solvent
    • Temperature
    • Charge
    • pH
    • Counter ions
    • Ionic strength

Analyze polymer-based systems with QCM-D

In practice, this means that QCM-D can be used to:

    • Analyze build-up dynamics of polymer layers and multilayers
    • Characterize structure and structural rearrangements
      • pancake, mushroom and brush
      • swelling, collapse, and crosslinking
    • Quantify the layer thickness
    • Quantify the mechanical properties of the layer
    • Analyze molecular interactions with polymer layer

Overview  Characterization of polymer-based systems with QSense  Download

How does QCM-D compare?

When you are to invest in a new QCM system, it is relevant to compare similar technologies as well as to evaluate QCM instruments from different suppliers to make sure you find a good fit for your lab.

Comparing QCM-D to other surface sensitive technologies

QCM-D is often compared to other surface sensitive real-time technologies, such as SPR and ellipsometry, which also provide information on molecule-surface interactions. So how does QCM-D relate to these two methods?

QCM-D vs SPR

QCM-D and Surface plasmon resonance (SPR) are similar in many ways. For example, both methods are used in surface inter­action analysis to monitor specific interactions, molecular binding, and adsorption events. As the two methods are based on different technologies and measurement principles, however, QCM being an acoustic technology and SPR being an optical one, there are differences in experimental capabilities and information extraction.

As already discussed, QCM measures the resonance frequency changes, f, of an oscillating quartz crystal which is sensitive to mass changes at the surface. SPR, on the other hand, measures change of the surface plasmon resonance angle, ϴ, which is sensitive to refractive index changes. In addition to f and ϴ, some QCM and SPR instruments are designed to capture addi­tional parameters, which then expands the amount of information that the respective tech­nology can extract. The information output offered by a QCM instrument ranges from qualitative information on time-resolved mass changes at the surface, to quantitative information about mass, thickness and viscoelastic properties at high time resolution. The information output offered by a standard SPR instrument ranges from relative infor­mation about refractive index changes at/ near the surface, to quantitative informa­tion about the refractive index, thickness, density, and surface coverage.

Overview  QCM-D vs SPR  Download

QCM-D vs Ellipsometry

QCM-D and ellipsometry also show many similarities. Both technologies provide real-time results on surface adsorption and desorption and allow for quantification of the surface mass density of layers at the solid-liquid or solid-gas interface. The operating principles of the two methods are however different; QCM measures acoustic changes, i.e., changes of a sound signal, whereas ellipsometry measures optical changes, i.e., changes of a light signal.

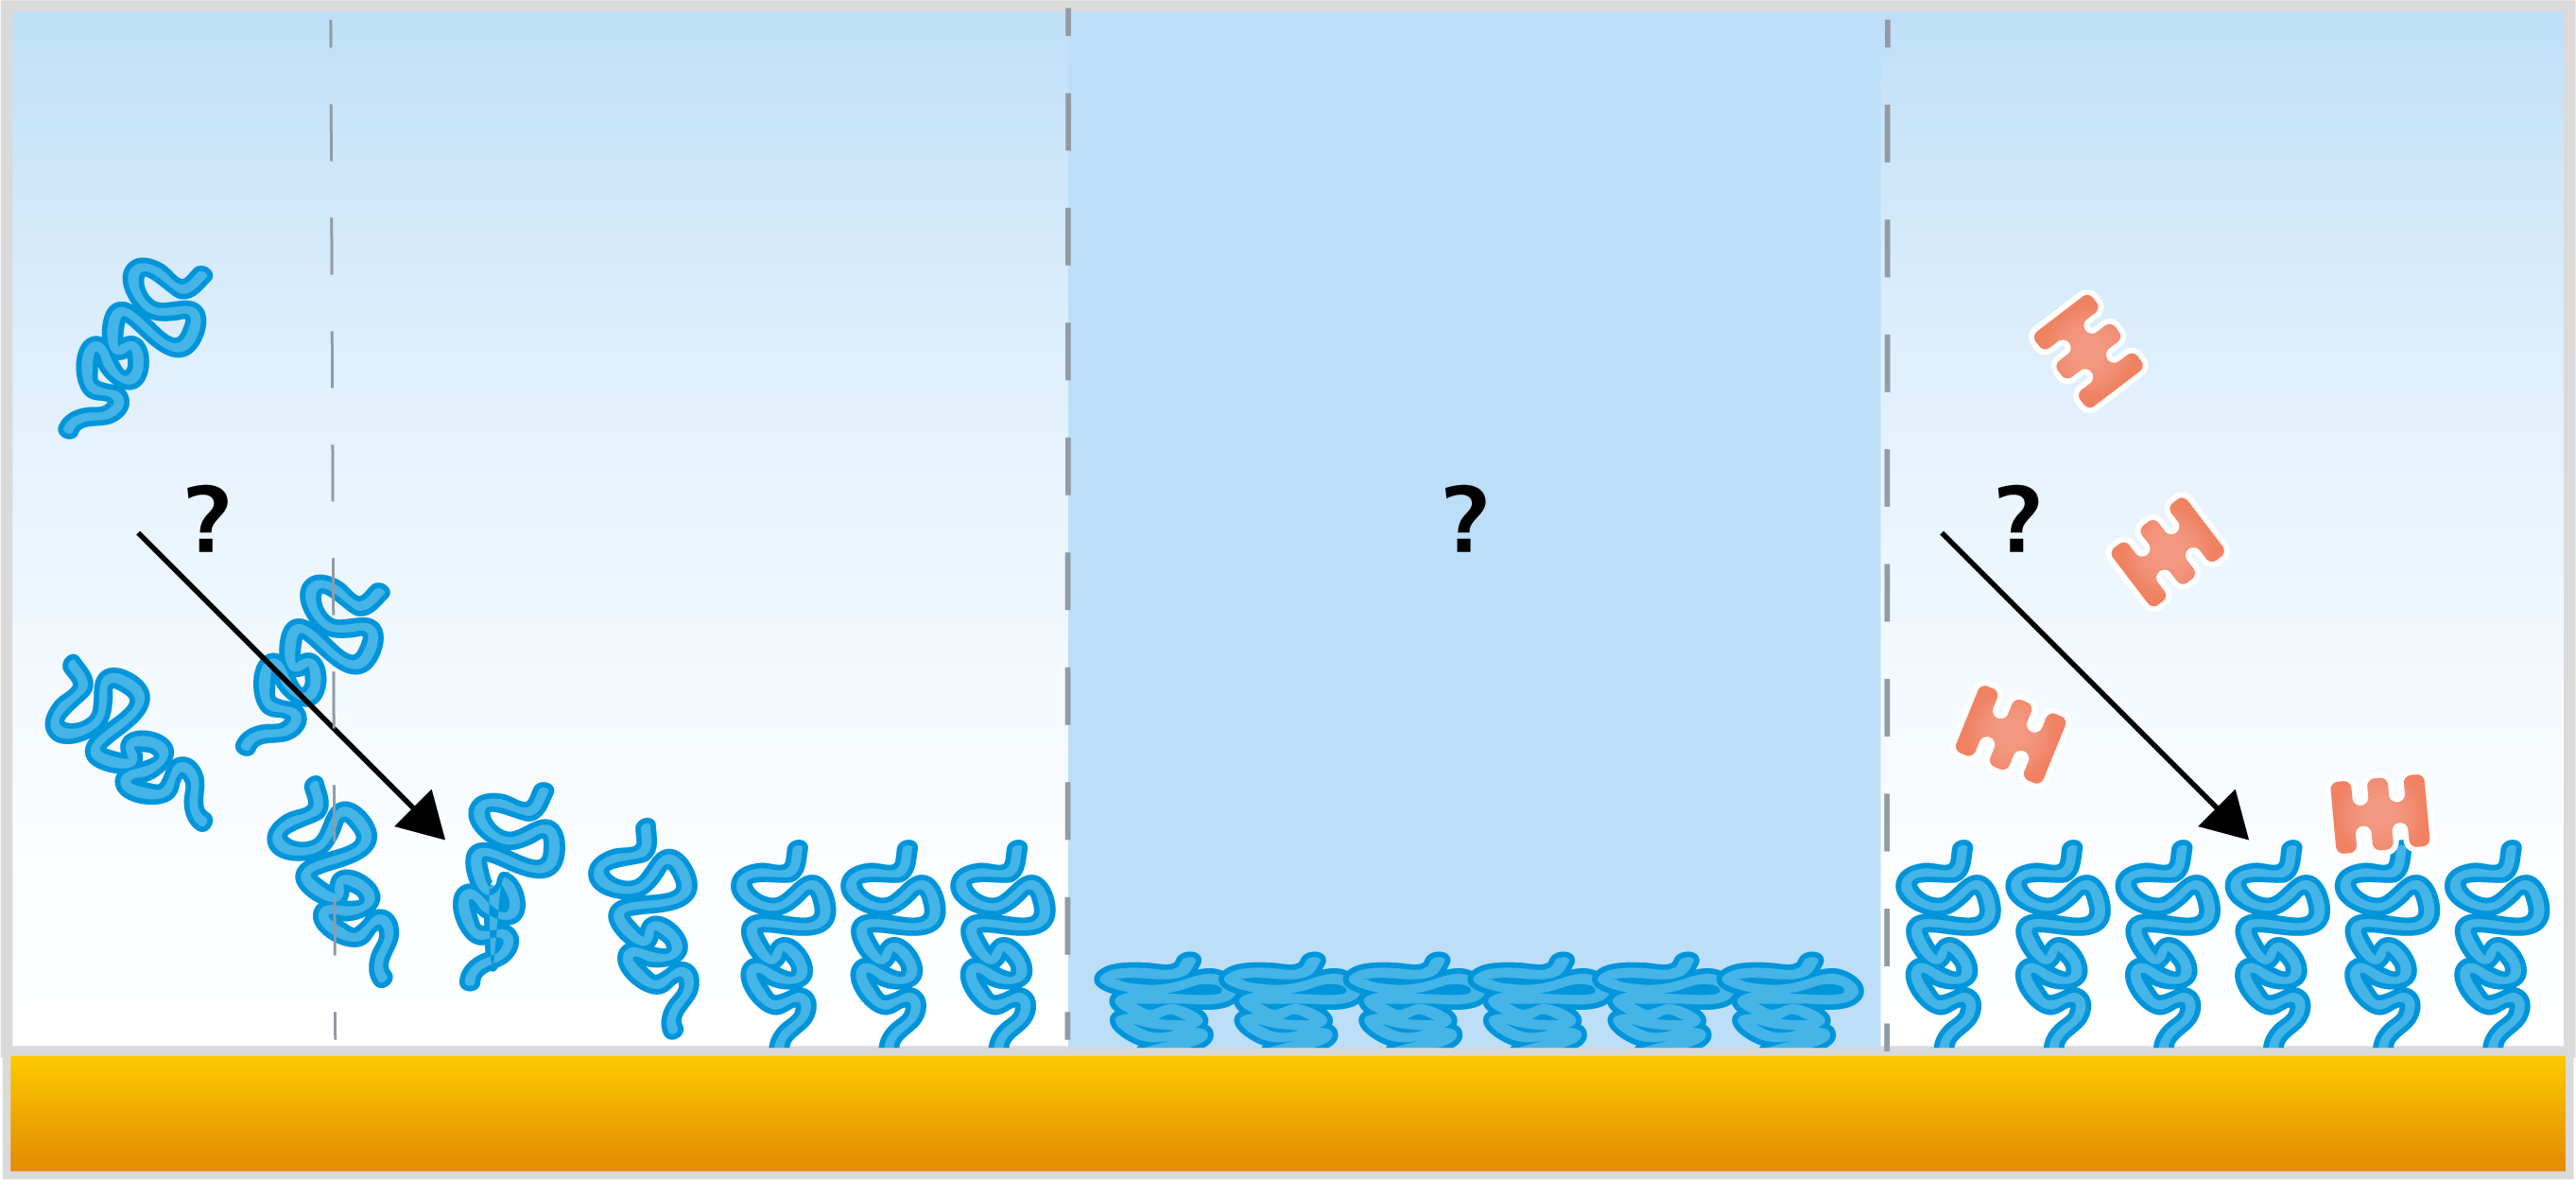
As already mentioned, both technologies are able to sense mass changes at the surface. Due to the differences in the working principles, however, the mass that is sensed differs between the two methods. The mass sensed by QCM technology includes not only the molecules adsorbed/bound to the sensor surface, but also the mass of the solvent associated with the adsorbed layer. Ellipsometry, on the other hand, measures mass excluding the associated solvent. This is the reason why optical mass is often referred to as “dry mass” and acoustic mass often referred to as “wet mass”. Since the two methods offer complementary information, using a combined setup, where QCM-D and ellipsometry can be run simultaneously on the same surface, makes it possible to extract information on variations in the amount of coupled solvent in the system under study, which is information that neither of the two techniques is able to extract when used on its own.
Application note  Combined QCM-D and Ellipsometry for thin film characterization  Download

QCM-D vs other QCM:s

There are a number of different QCM:s available in the market - standard QCM:s, which only measure the resonance frequency, extended QCM:s – which in addition to the frequency also measure the energy loss, single-harmonic QCM:s which typically only measure at the fundamental resonance frequency, and multi-harmonic QCM:s – QCM:s which measure at multiple harmonics. In addition to this, several aspects of the instrument specifications, for example the fundamental resonance frequency, can vary between the instruments.

Standard QCM

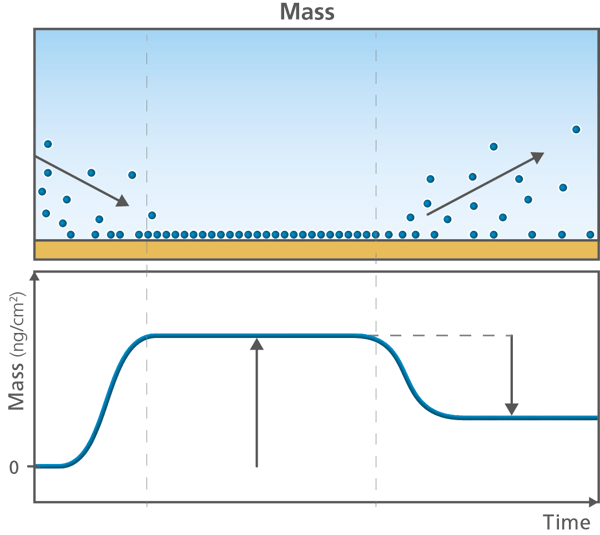
In brief, standard QCM measures changes in resonance fre­quency of the quartz crystal upon excitation by a driving voltage. This measurement allows for monitoring of changes in mass or thickness of thin and rigid layers adhering to the surface of the quartz crystal sensor. If the adsorbed (or bound) layer obeys the requirements of the Sauerbrey relation, information about mass and thickness of the layer can be extracted.

Extended QCM - QCM that monitors the energy loss

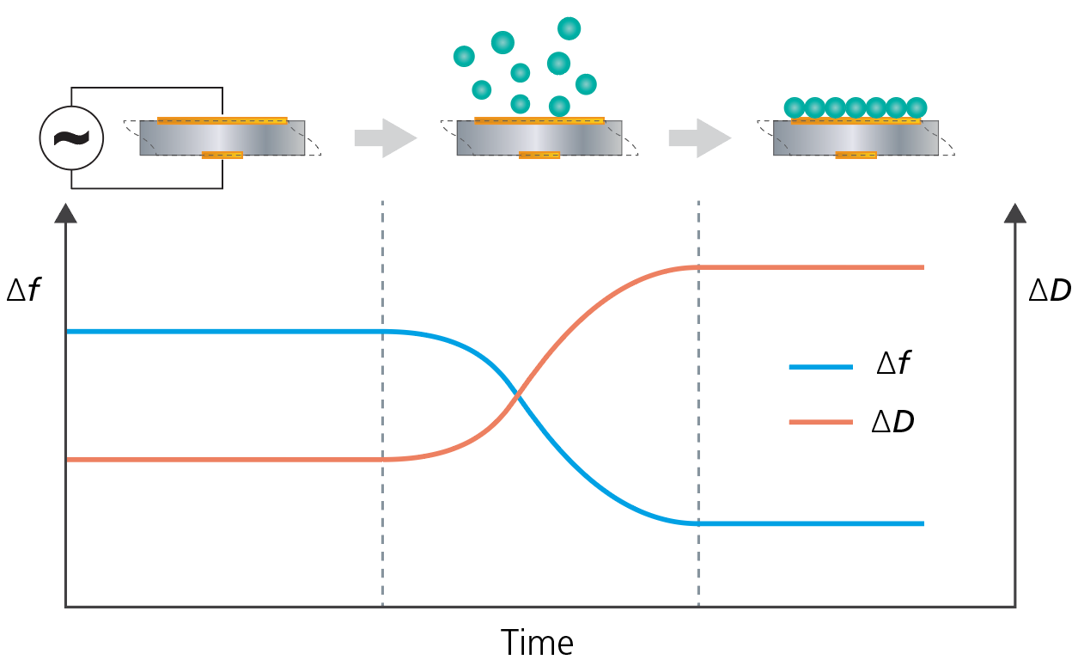
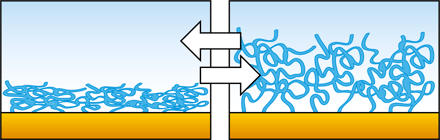
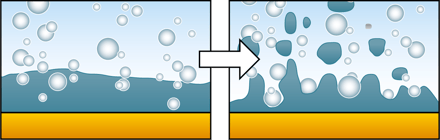
Instruments such as QCM-D, QCM-I, QCM-R, etc., are extended versions of the standard QCM. In addition to measuring changes of the resonance frequency, f, these QCM:s also measure changes of the energy loss, the dissipation.

In brief, there are three different ways to measure the energy loss -  via 1) impedance spectroscopy, via 2) the decay time of the oscillation, or 3) by measuring the resistance. The various approaches provide different amounts of information about the system under study. Thanks to the additional inormation provided by the extended QCMs, it is for example possible to reveal whether the measured layer is rigid or not, and if the Sauerbrey equation can be used for the quantification of mass.

Overview  What is Dissipation and why is it important?  Download

Single-harmonic vs multi-harmonic QCM

Like a guitar string, a QCM crystal can be excited to resonate at several different harmonics. A single harmonic QCM excites the crystal at one frequency whereas a multi-harmonic QCM excites the crystal at multiple frequencies. The number of frequencies measured by a multi-harmonic QCM can vary from two and up. Single harmonic QCMs typically use the fundamental while multi-harmonic QCMs use the fundamental frequency and one or several overtones.

Each harmonic measured provides information about the system under study. If f and D are collected at multiple harmonics, it is possible to quantify mass, thickness and visco­elastic properties of soft layers, i.e. multi-harmonic QCM-D technology enables quantifi­cation of mass and thick­ness of rigid as well as of viscoelastic layers.

Overview  Working principles of QCM and QCM-D technology  Download

Which QCM will suit your needs?

Each of the QCM-versions here discussed are suitable for different types of measurements and experimental contexts. Which QCM you should go for therefore depends on your specific application and how carefully you need to characterize the system that you plan to work with. Key questions to ask are:

  1. Will measurements be taken in the gas phase or in the liquid phase?
  2. Will viscoelastic layers be studied?
  3. Will the processes studied be fast or slow?
  4. Is quantitative information needed, or will qualitative information be sufficient?

Overview  QCM-D vs other QCM:s  Download

How to assess and compare QCM-specifications

Once you have decided which type of QCM instrument you need, and have identified possible suppliers, it is time to compare the specifications for the different instruments that you are choosing between. Assessing and comparing QCM specifications can, however, be tricky, as they do not always include the same information, and the terminology used to describe a certain property can differ. One approach to facilitate the comparison of the information provided in the specificatrions is to identify the parameters that are relevant to the actual measurement situation, and to look at the unit of the specified numbers to compare the information between different suppliers.

Guide  How to read a QCM specification  Download


If you are interested in a QSense instrument, have a look at our full range of products, try our instrument selector, or reach out to us to start a conversation about your research needs. 

Save it for later?

Download the pdf version of this page to read when you have the time.

Download the guide
QCM-D-measurement

Save it for later?

Download the pdf version of this page to read when you have the time.

Download the guide