Quartz Crystal Microbalance, QCM, is a surface sensitive real-time technology that can be used to monitor molecular interaction at surfaces and interfaces via detection of changes in the resonance frequency of the QCM sensor. Using the Sauerbrey equation, the frequency change can be converted to change in mass, allowing characterization of mass uptake and mass loss at the surface.
QCM technology, which is essentially a balance for very small masses, has been around since the 60’s. With a mass resolution typically in the ng/cm2 range, it enables monitoring of build-up and removal of thin and rigid layers at the sensor surface. Traditionally, it was used for monitoring of thin-film deposition in vacuum and gas phase, but in the last couple of decades the traditional QCM configuration has evolved and extended versions, such as QCM-D, now exist. This has enabled the usage of the technology to expand and spread into other applications, and the method is now commonly used for liquid-phase measurements.
The core of QCM technology is the sensor, which is traditionally made of quartz, a piezoelectric material. A thin disk of the piezoelectric material is sandwiched between two electrodes, Fig 1A. Applying an electric field over the disk, there will be a mechanical oscillation, Fig 1B. The resonance frequency depends on the sensor design and is typically 5-10MHz, but it can be both lower and higher.
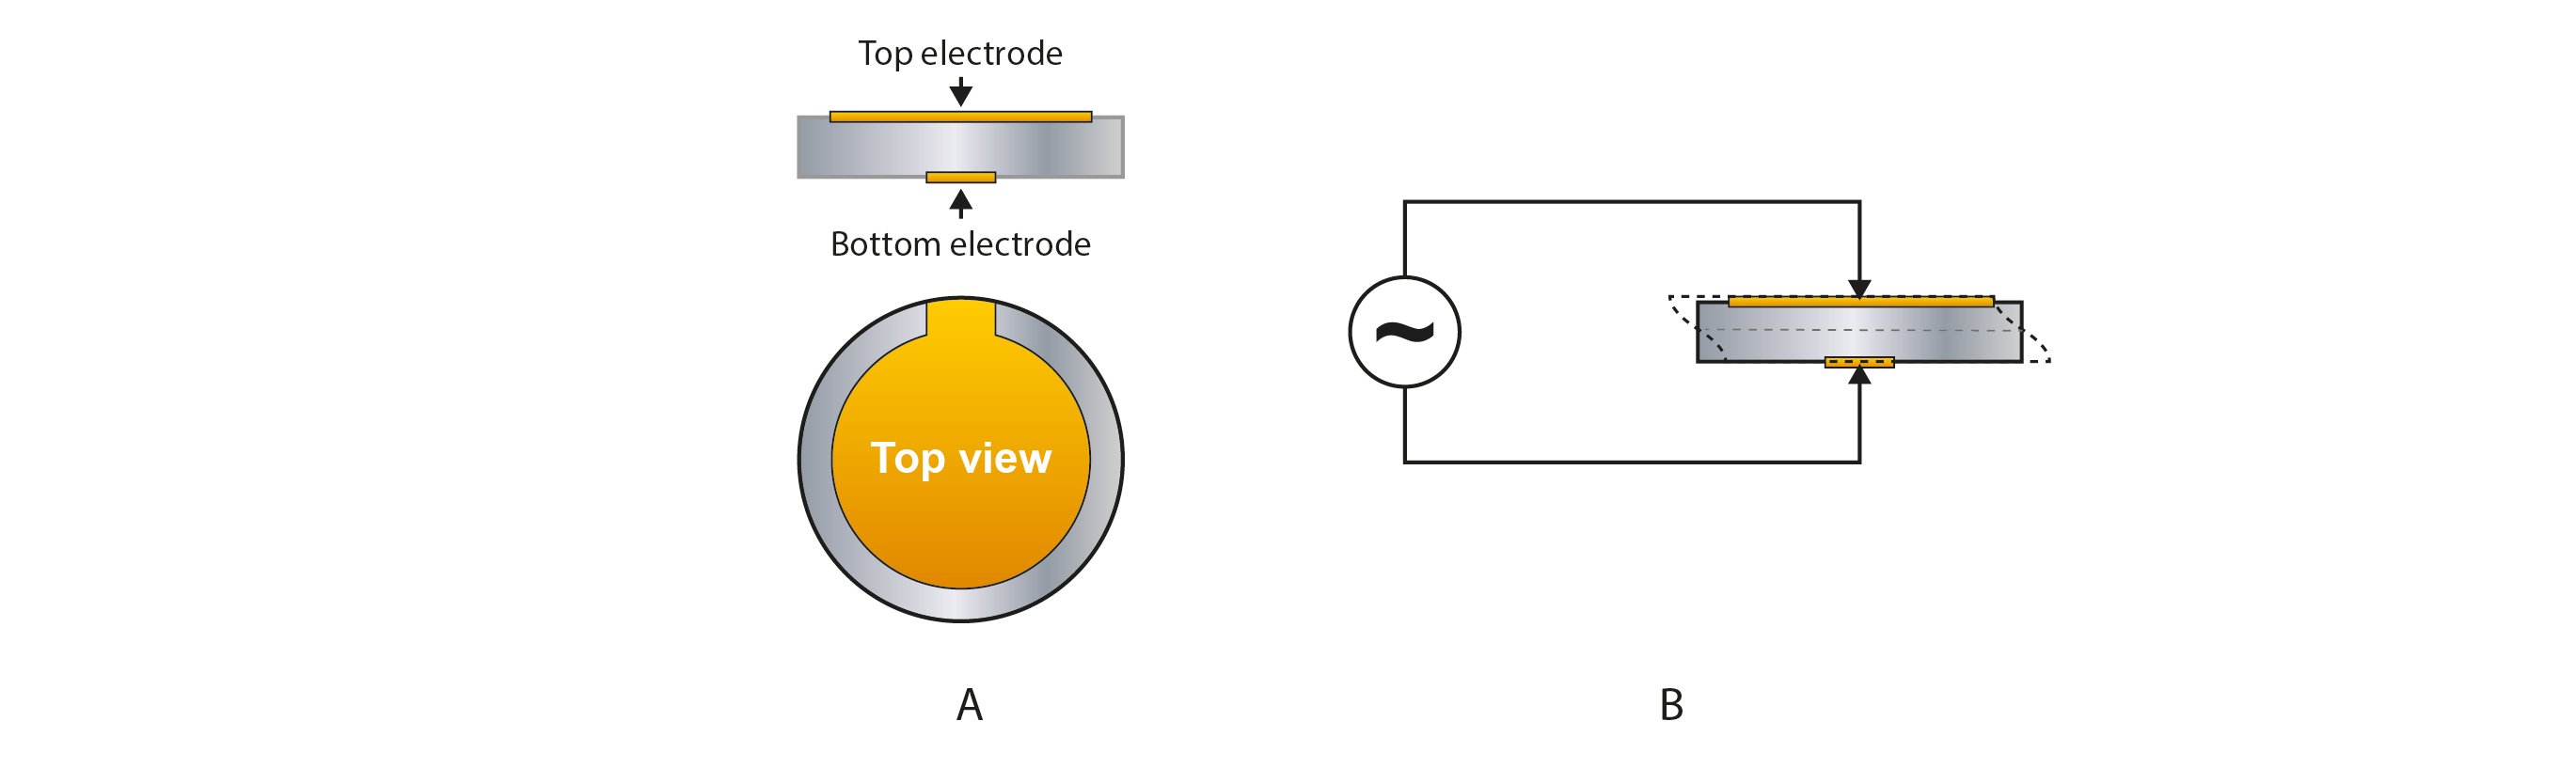
Figure 1. Schematic illustration (not to scale) of a (A) QCM sensor made of a thin disk of a piezoelectric material sandwiched between two electrodes. The disk material is typically quartz, and the electrodes are typically made of gold, but other materials can be used. In (B), an alternating voltage is applied over the sensor, inducing a mechanical oscillation of the sensor
The QCM measurement is achieved by monitoring the change in resonance frequency, Δf, when mass is added to, or removed from, the sensor surface. When mass is added, the resonance frequency decreases, Fig. 2, and vice versa.
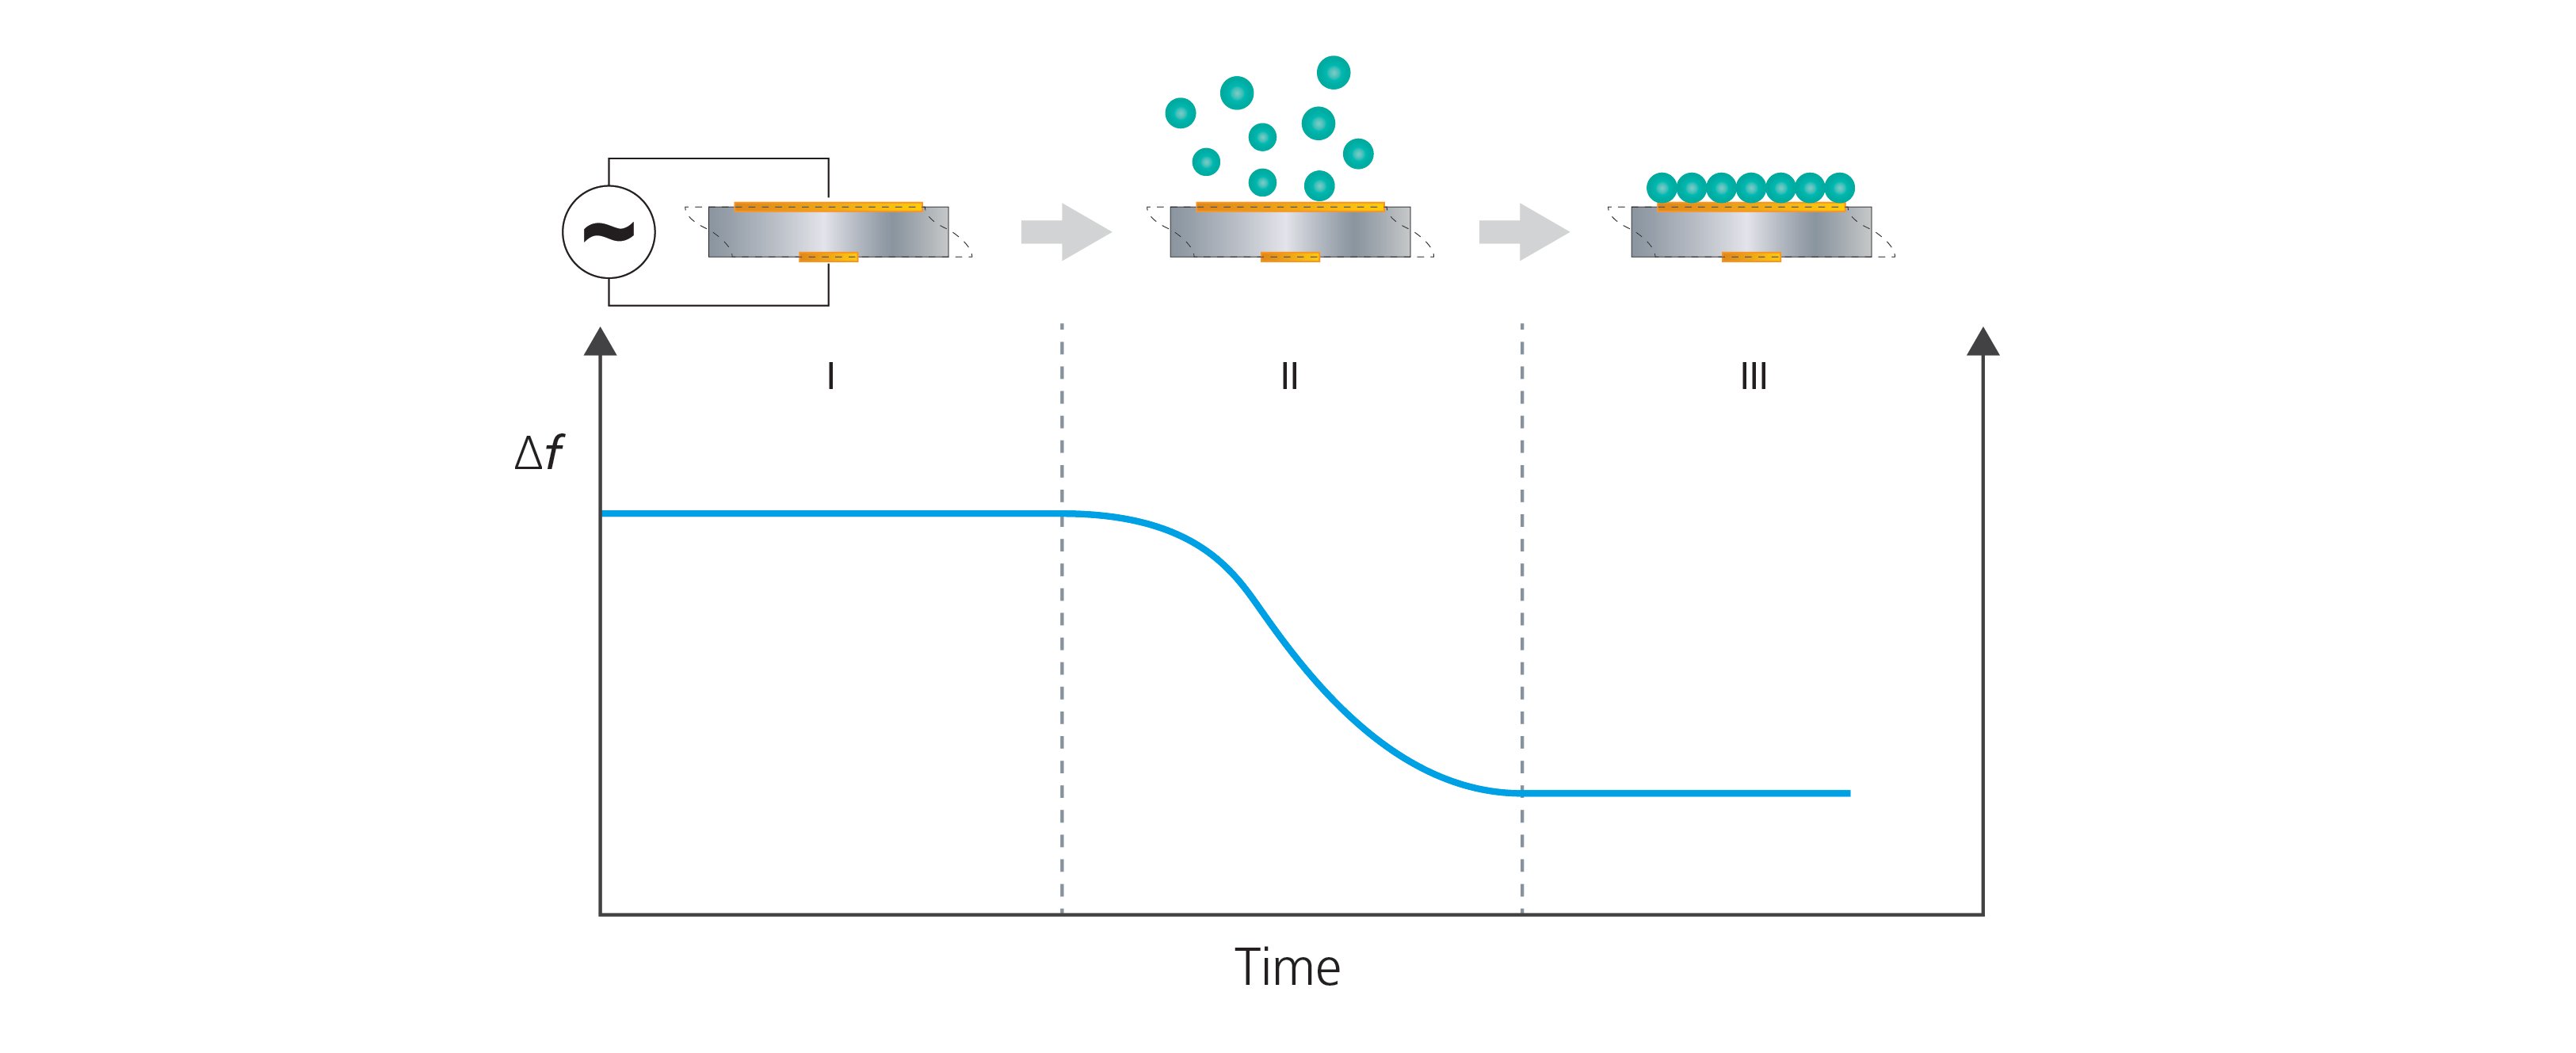 Figure 2. QCM technology collects time-resolved information on frequency changes of the QCM sensor and can detect mass uptake at the sensor surface. The schematic illustration shows (I) a bare sensor surface and a stable baseline of Δf. In step (II), molecules adsorb to the sensor surface which results in a frequency decrease. In (III), the surface uptake has been completed and the frequency response has stabilized. The frequency shift between I and III can be used to quantify the mass uptake at the sensor surface.
By following the changes in Δf, molecule – surface interaction can be detected and mass uptake and release from the surface can be quantified, Fig 3.
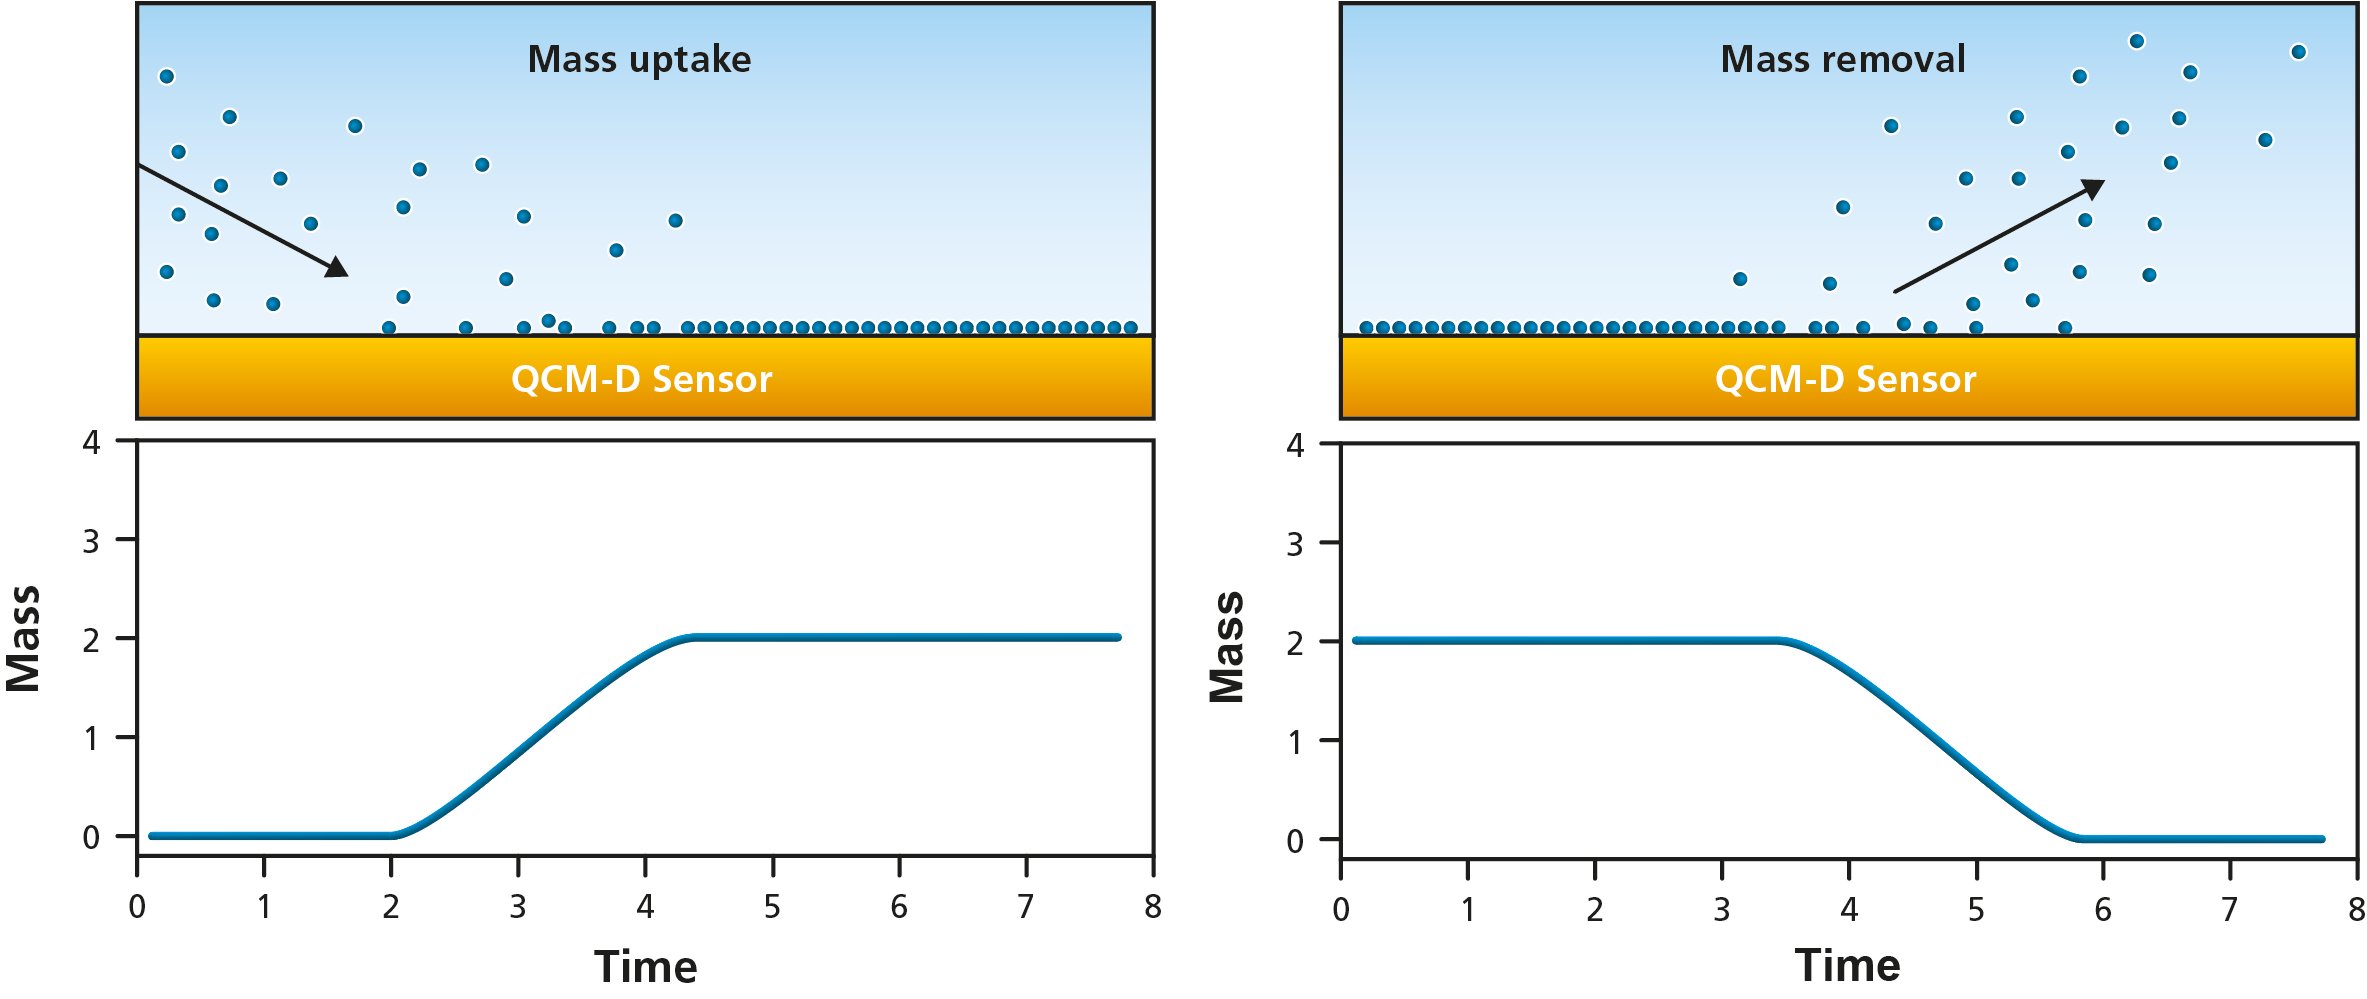 Figure 3. Schematic illustration of molecules (left) adsorbing to and (right) desorbing from the QCM sensor surface. The bottom panels illustrate the resulting changes in quantified mass, i.e., mass uptake as molecules adsorb and mass loss as they leave the surface.
In summary, QCM technology is a real-time, surface-sensitive technique that monitors the change in mass or thickness of layers adhering to the surface of the QCM sensor. This is achieved by measuring the change in resonance frequency of the quartz crystal upon excitation by a driving voltage.
Download the overview to learn more about QCM technology and how it works.


Malin graduated in engineering physics in 2006, where her research focused on the QCM-D technology. Since then, she has been scrutinizing the how’s and why’s of the world in general, and the world of QCM-D in particular.