Quartz Crystal Microbalance with Dissipation monitoring (QCM-D) is a surface-sensitive, label-free, and non-invasive technology for measuring mass changes and viscoelastic properties of surface-adhering layers with nanoscale resolution. For more than two decades, QCM-D has been widely used to analyze molecule-surface interactions—such as adsorption, desorption, binding events, and structural changes—in real time. Today, it is applied across an expanding range of fields, from biointerface science to energy and environmental science.
QCM-D operates by monitoring changes in the resonance frequency (Δf) and energy dissipation (ΔD) of a quartz crystal sensor. In brief, when molecules adsorb to the sensor surface, the frequency decreases, indicating an increase in mass, Fig. 1. Conversely, a frequency increase signals mass loss. The dissipation provides insight into the softness or rigidity of the adsorbed layer—higher dissipation values suggest a softer or thicker layer. This dual measurement enables characterization and quantification of processes at the solid-liquid interface in real time.
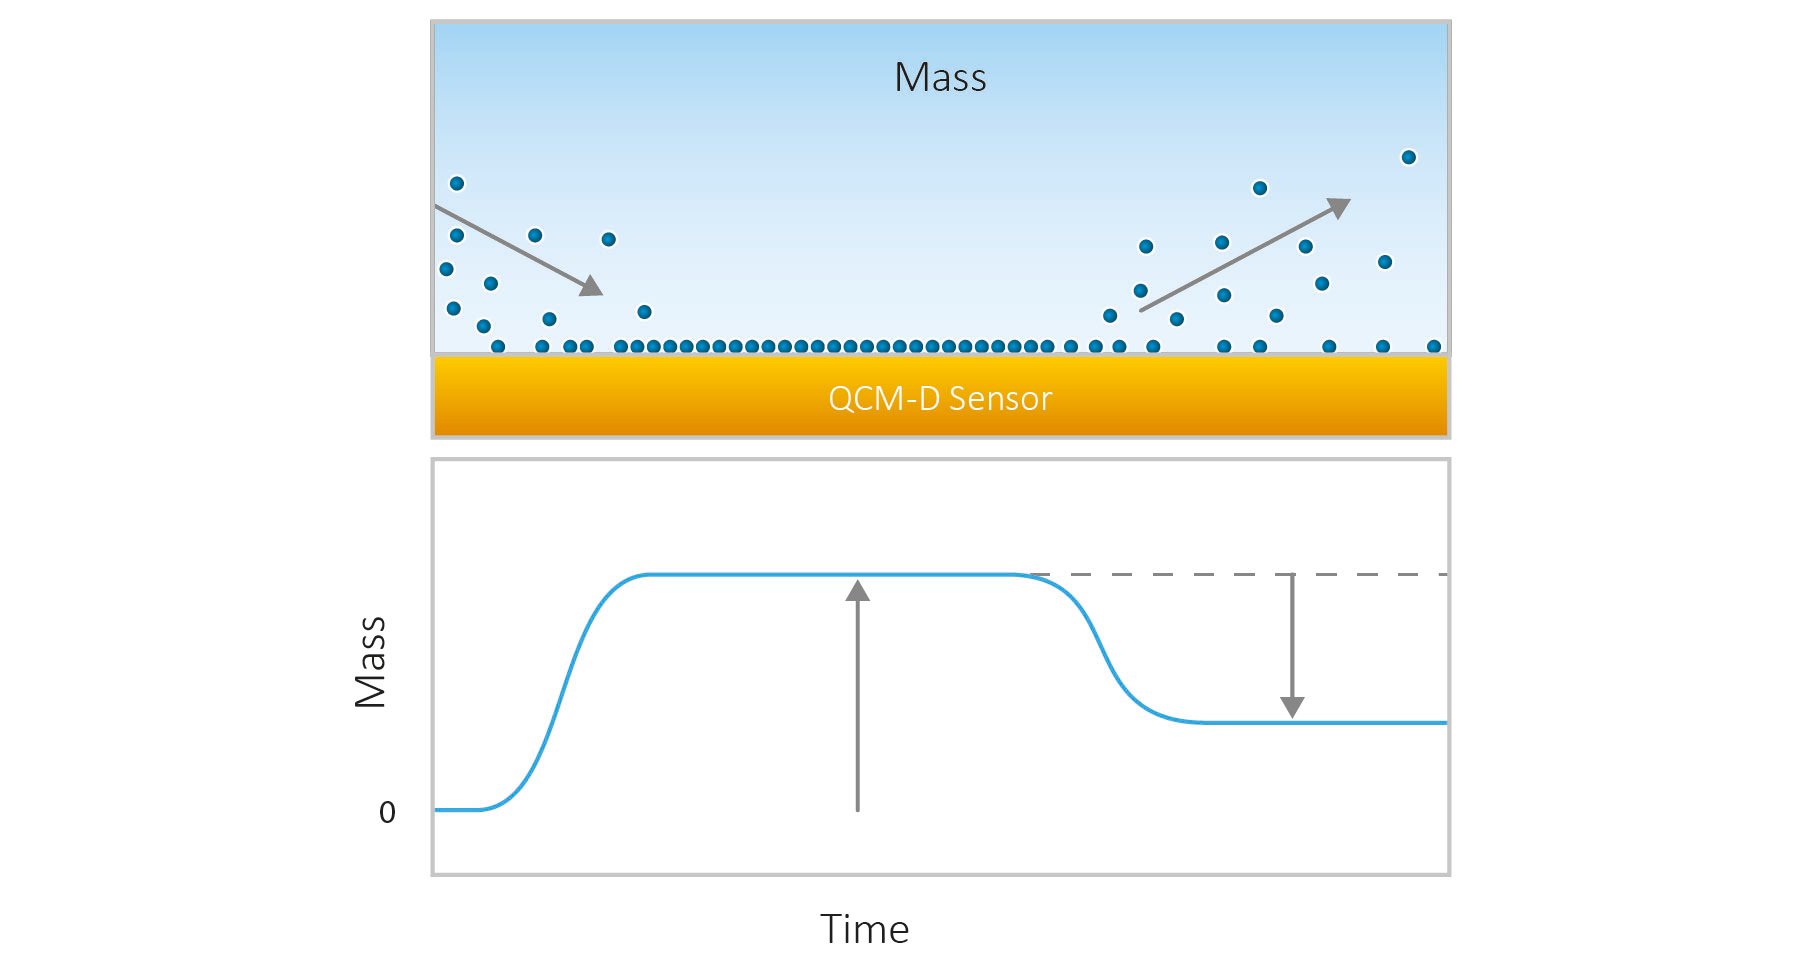
Figure 1. Schematic illustration of mass uptake and mass loss as molecules adsorb to and desorb from the QCM-D sensor surface.
To go into more detail, QCM-D is an extended version of the Quartz Crystal Microbalance (QCM). The fundamental working principle of QCM-D is the same as that of QCM: a piezoelectric quartz crystal sensor is excited to resonance by the application of an alternating voltage, and the resonance frequency (Δf) is monitored over time, Fig. 2. The resonance frequency of the sensor depends on its mass (or thickness). Changes in frequency (Δf ) reveal changes in the mass coupled to the sensor surface and can be used to detect and analyze molecule-surface interactions, such as adsorption and desorption, which appear as mass uptake and mass loss, respectively.
In addition to measuring Δf, QCM-D also measures the energy loss—known as dissipation, ΔD —of the system under study. The ΔD value reflects the mechanical properties of the surface-adhering layer. When combined with Δf, it can be used to quantify the mass, thickness, and viscoelastic properties of soft layers—something not possible by analyzing Δf alone. The combined information provided by Δf, and ΔD makes QCM-D particularly suitable for the analysis and characterization of hydrated systems, which are often viscoelastic.

Figure 2. Schematic illustration of the working principle of QSense QCM-D, a multi-harmonic QCM-D instrument. Through rapid, periodic excitation (“pinging”) of the driving power (upper left), the system captures time-resolved data on frequency (f) and decay time (inversely proportional to dissipation, D) at multiple harmonics. This enables real-time plotting of changes in Δf and ΔD as molecules interact with the sensor surface (top). In the schematic scenario and plot: (I) The bare surface shows stable baselines for multiple Δf and ΔD traces. (II) As molecules bind to the surface, frequencies decrease and dissipations increase, indicating mass uptake and greater energy loss. (III) Once surface uptake is complete, frequency and dissipation responses stabilize. These data can be used for viscoelastic modeling and quantification of the mass, thickness, and viscoelastic properties of the adsorbed layer.
QCM:s sense the hydrated mass, i.e. mass including both the molecules adhering at the sensor surface and any solvent coupled to them. This feature makes QCM-D an excellent tool to analyze layer structure, and to detect structural changes, of the molecular layer, such as for example swelling and collapse or formation of supported lipid bilayers via vesicle rupture and fusion. In a scenario where there is a structural change within the layer, the molecular mass will be the same throughout the rearrangement process, but the mass of the associated solvent will vary. For example, if a highly hydrated polymer layer undergoes a collapse, QCM-D will detect a mass loss as the layer transitions from the highly hydrated state to the collapsed state. The detected mass loss reflects that a smaller amount of solvent is coupled in the collapsed state compared to in the hydrated state. The QCM-D data will also reveal a transition from a soft to a more rigid layer. This makes QCM-D especially valuable for studying soft, hydrated, or biological layers, such as polymers, proteins, or cell membranes.
In brief, QCM-D enables real-time monitoring of:
QCM-D is used in a very wide range of scientific and industrial fields, including:
QCM-D is especially valuable for monitoring dynamic processes at the surface, such as adsorption/desorption, binding, swelling, crosslinking, fouling, and layer degradation. The technology provides both qualitative and quantitative data on mass changes and viscoelastic properties, making it indispensable for both fundamental research and applied product development in academia and industry.
QSense QCM-D instruments are designed to deliver high-quality, reproducible results. For detailed guidance on measurement procedures and data analysis, explore our expert articles on QCM-D best practices, troubleshooting, and advanced data analysis here at the blog. Topics include sensor preparation, measurement setup, running experiments, and post-measurement care—providing actionable tips and in-depth explanations for every step of your QCM-D workflow.
QCM-D is a versatile and sensitive tool for studying molecular interactions at surfaces and interfaces. Its ability to deliver real-time insights into both mass changes and viscoelastic properties has made it indispensable in fields ranging from biomaterials and medical devices to energy research and nanotechnology. Whether you are new to QCM-D or looking to deepen your expertise, building a strong foundation in its principles, applications, and best practices will empower you to design better experiments and extract more meaningful data - the true power of QCM-D lies not just in the numbers it provides, but in the dynamic stories those numbers reveal about the phenomena and systems that you are studying. If you are curious to learn more about the fundamentals, download the overview of the working principles of QCM and QCM-D below. For further learning, explore our library of QCM-D resources, guides, and case studies. If you have specific questions or want to discuss how QCM-D can advance your research or product development, our experts are here to help.


Malin graduated in engineering physics in 2006, where her research focused on the QCM-D technology. Since then, she has been scrutinizing the how’s and why’s of the world in general, and the world of QCM-D in particular.