In the pursuit of high-quality measurements and trustworthy results in quartz crystal microbalance (QCM) studies, the significance of even mass distribution on the sensor surface cannot be overstated. Originally penned by a reputable expert and one of the inventors of the QCM-D technology, this article provides a comprehensive explanation of why even mass distribution is crucial and the potential consequences of its absence. As we republish this insightful piece, its relevance remains undiminished, offering valuable insights for QCM data interpretation. Whether you are a new to the QCM technology or an experienced practitioner, this article serves as an essential resource for enhancing the quality of your QCM measurements.
In the context of QCM-data quantification, it is repeatedly stated that the layer at the surface should be evenly distributed over the sensor surface. Why is this so often stressed, and what will the consequence be if it is not fulfilled? Here we explain the reasoning behind the uniformity requirement and explain possible consequences if it is not fulfilled.
The QCM surface is oscillating back and forth and it is the coupling of mass to this oscillation that is the basic sensing principle. However, the amplitude of oscillation is not constant across the crystal surface. How it varies depends on the geometry of the sensor and its electrodes. Standard, disk-like sensors have, to a good approximation, a radial dependence, A(r), according to Eq. 1.
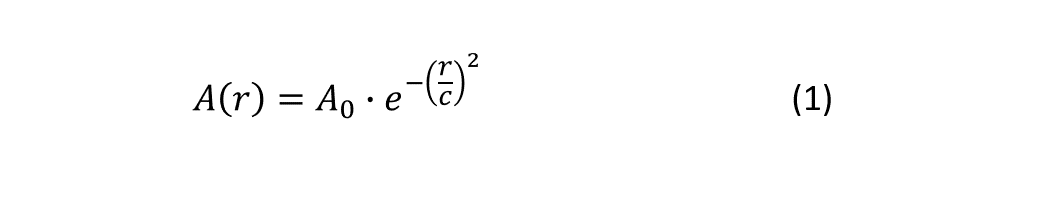 The maximum oscillation amplitude, A0, is reached in the middle of the crystal at r=0, and then the amplitude decreases towards the edge, to reach close to zero displacement at the edge, or even before the edge. The width of the gaussian, c, is different for different harmonics. The higher the overtone, the sharper the gaussian, see Fig 1.
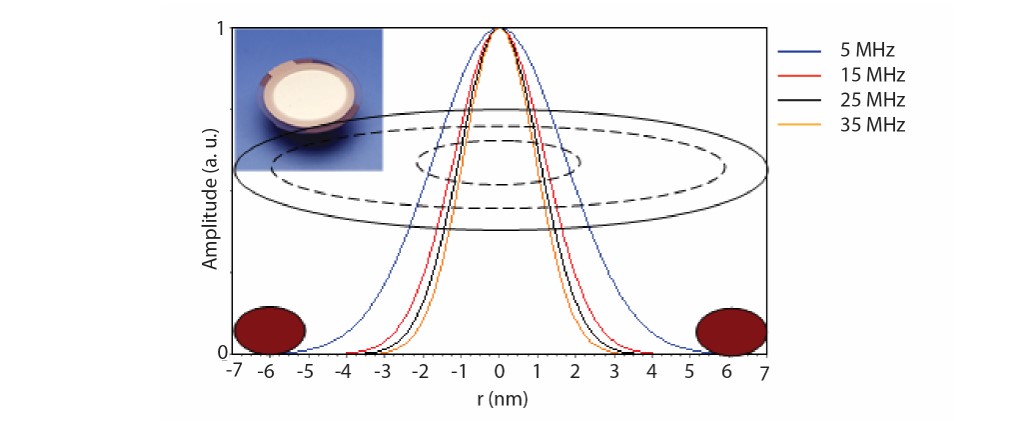
Figure 1. Normalized distribution of the crystal oscillation amplitude at n = 1, 3, 5 and 7 for a 5 MHz crystal, measured at Biolin Scientific. The width of the gaussian depends on the overtone number, the higher the harmonic the sharper the Gaussian. The dashed lines indicate the top (large dashed circle) and bottom electrodes (small dashed circle). The brown ellipses represent cross-sections of the top O-ring.
The force exerted on a particle that is fixed on the sensor surface is directly proportional to the amplitude of oscillation at the fixing point times the mass of the particle. And Newton taught us that the force on the sensor is equal in size to that of the force on the particle. It is then easy to understand that a particle placed at the crystal center will cause a larger force, and hence frequency shift, than if it was placed at the crystal edge, Fig. 2.
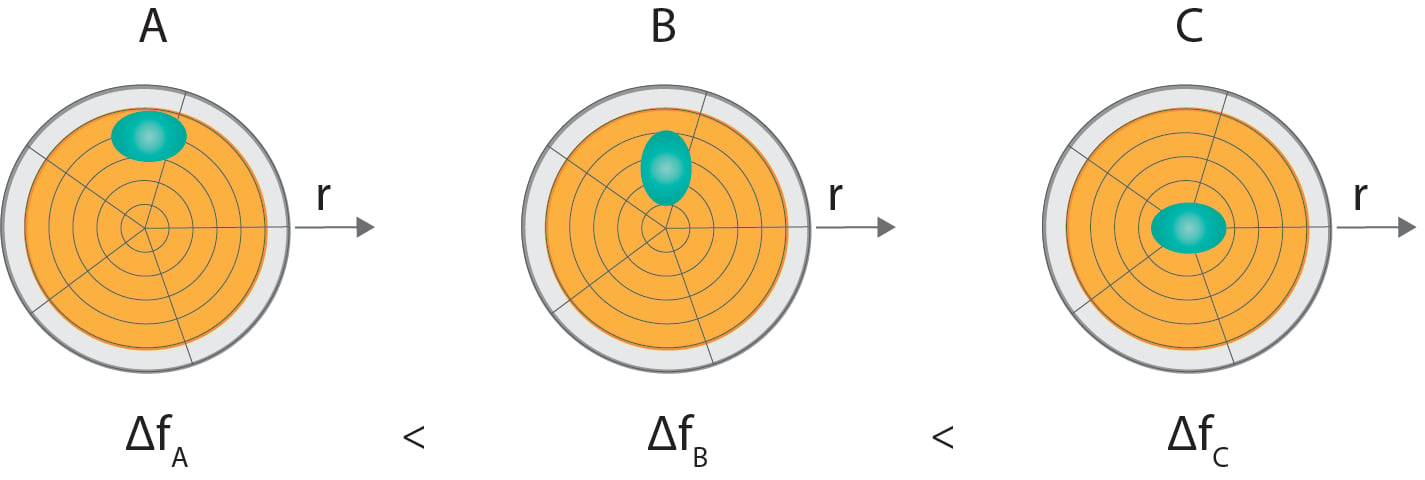
Figure 2. Illustration of how the frequency shift caused by a localized mass deposited at the sensor surface depends on where the mass is placed. The mass sensitivity varies with the sensor radius according to a Gaussian function (Fig. 1). Therefore, a mass deposited at the rim (A) will generate a smaller frequency shift than if the mass is deposited closer to the middle (B). Mass deposition at the middle (C) will generate the largest response.
The frequency shift that is recorded in a measurement is the sum of all local (force) contributions from the entire sensor surface. We are now at the crux of the problem. Placing 1000 particles at the peripheral could give the same frequency shift as placing 10 of those particles close to the center of the sensor, or vice versa. This means that the same number of particles (i.e. same total mass) can give different frequency shift depending on how they are distributed on the sensor surface. So, if you don’t know the mass distribution of the particles/film you are measuring, it is not possible to reliably convert a frequency shift to a total mass of the particles/film.
Is all then lost if you have uneven and unknown mass distribution? Not quite: If all particles change their mass by X%, then the sum of forces (and the measured frequency shift) will also change by X% regardless of how the particles are distributed. This means that you can still compare the relative change in one mass distribution with another.
An example could be that you want to determine which of a set of detergents best removes fingerprints. You would likely get different frequency shifts due to the fingerprint depending on where you place it on the sensor. But you can still evaluate the detergents’ efficacy by comparing how quickly they remove say 90% of the fingerprints’ initial frequency shift.
If you would like to save the text for later, download it as a PDF below.


Dr. Michael Rodal is a former employee at Biolin Scientific and a guest writer on the blog. Michael did his Ph.D. in engineering physics and is one of the inventors of the QCM-D technology as well as co-founder of Q-Sense AB. Having developed, and worked with, the technology since the ’90s, Michael is one of the world's leading QCM-D experts.

