Traditional Quartz Crystal Microbalance (QCM) technology is primarily used for characterizing thin and rigid films. However, its limitations have been addressed with the development of Quartz Crystal Microbalance with Dissipation monitoring (QCM-D), which extends the capability to characterize soft or thick films by also measuring energy losses. Here we explain how QCM-D works.
Piezoelectricity and the QCM working principle
At the heart of QCM technology is the quartz crystal. The QCM sensor comprises a thin quartz crystal disk sandwiched between two electrodes. Quartz is a piezoelectric material, meaning mechanical deformation induces a charge movement, and an applied electrical field results in mechanical deformation. When a voltage is applied to the QCM sensor electrodes, the crystal changes shape, depending on the crystal cut and voltage direction. Quartz crystals in QCM applications are cut to shear the disk in the thickness direction. Applying an alternating voltage causes the disk to oscillate in sync with the voltage.
Quartz Crystal Microbalance with Dissipation monitoring, QCM-D, is based on the same working principle as QCM, i.e. it measures the resonance frequency changes, Δf, of a quartz crystal as a function of time. In addition to the frequency capture, QCM-D also collects time resolved information about the energy losses, the dissipation. I. e. QCM-D collects Δf and ΔD as a function of time, Fig 1, whereas QCM collects Δf as a function of time. This dual measurement capability allows for a more comprehensive analysis of molecular interactions at the sensor surface.

Figure 1: A traditional QCM captures time-resolved frequency changes to reveal mass adsorption on the sensor surface. The schematic shows: (I) a bare surface with stable baselines of Δf. (II) binding of molecules leading to a frequency decrease indicating mass uptake, and (III) stabilization of frequency response post-uptake
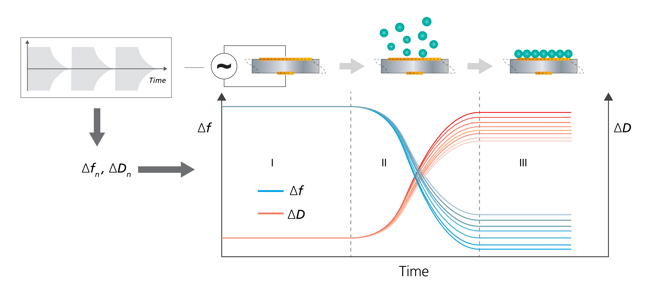
Figure 2. The figure shows a schematic illustration of the working principle of QSense QCM-D, a multi-harmonic QCM-D, which via so-called pinging provides time resolved information on f and D at multiple harmonics. Via a rapid, periodic excitation of the driving power (upper left), the oscillation frequency, f, and the decay time, which is inversely proportional to D, can be captured and thereby, time-resolved information of changes in Δf and ΔD can be plotted as molecules interact with the sensor surface. In the schematic adsorption scenario and plot, section (I) shows a bare surface and stable baselines of multiple Δf:s and ΔD:s. Period (II) shows how molecules bind to the surface, and as a result, the frequencies decrease and the dissipations increase, indicating mass uptake and increasing energy loss. Period (III) shows how the surface uptake has been completed, and the frequency and dissipation responses have stabilized. The collected QCM-D data can be used for viscoelastic modelling and quantification of mass, thickness and viscoelastic properties of the adsorbed layer.
The benefit of measuring the dissipation in addition to just the frequency, is that you get information on whether the layer at the sensor surface is rigid or not, and if the Sauerbrey equation can be used for the quantification of mass. Also, if f and D are collected at multiple harmonics, it is possible to apply viscoelastic modelling on the data.
QCM-D technology simultaneously measures two parameters in parallel, the resonance frequency, f, and the dissipation, D, offering a richer dataset for analyzing surface interactions. QCM-D:s currently in the market measure the dissipation either via the bandwidth, or via measuring the oscillation decay time after the driving power has been switched off, so-called pinging. QSense QCM-D is based on the pinging approach.
Download the overview to learn more about QCM-D technology and how it works.


Malin graduated in engineering physics in 2006, where her research focused on the QCM-D technology. Since then, she has been scrutinizing the how’s and why’s of the world in general, and the world of QCM-D in particular.