
QSense QCM-D, Quartz Crystal Microbalance with Dissipation monitoring, can be used to monitor and quantify mass and thickness changes of thin films and molecular layers in real time. By monitoring changes in resonance frequency, Δf, and dissipation, ΔD, the technique makes it possible to follow how material adsorbs to, desorbs from, builds up on, or is removed from a surface.
Mass and thickness are central parameters in thin film characterization because they describe how much material is present at the interface and how the layer evolves over time. But in many applications, mass and thickness are not the final parameters of interest by themselves. Instead, they are measurable readouts that reveal what is happening at the surface, for example adsorption, desorption, film build-up, swelling, collapse, degradation, or enzymatic cleavage.
Mass and thickness can be important quantitative parameters in themselves, but they are also useful readouts of what is happening at the surface. Changes in mass and thickness can show whether molecules are adsorbing, desorbing, binding, building up into a film, swelling, collapsing, degrading, dissolving, or being removed.
In many applications, the key question is not simply “What is the mass?” or “What is the thickness?” but rather “What is happening at the interface, how fast is it happening, and how much does the layer change?” QSense QCM-D helps answer these questions by monitoring mass and thickness changes in real time together with dissipation, which provides information about the softness and viscoelastic properties of the layer.
Thin films are often dynamic. They may form, reorganize, swell, collapse, or degrade in response to changes in temperature, pH, salt concentration, humidity, solvent composition, or light exposure. By monitoring mass and thickness changes in real time, QSense QCM-D makes it possible to follow these processes as they happen.
This is useful not only for determining the final amount of material at the surface, but also for understanding the pathway by which the layer forms, changes, or is removed. For example, a film may show a rapid initial mass uptake followed by slower rearrangement, or it may first swell by taking up solvent and then collapse into a thinner, more compact structure.
QSense QCM-D is an acoustic, surface-sensitive, and label-free technique. It measures changes in the resonance frequency, f, and energy dissipation, D, of a quartz crystal sensor as material interacts with the surface
The frequency shift reflects changes in the mass coupled to the sensor surface. For soft or viscoelastic layers, where Δf does not directly convert to mass via the Sauerbrey relation, see the modeling note below.
When mass increases at the surface, the frequency typically decreases. This can happen when molecules adsorb, bind, or when a film takes up solvent. When mass is lost from the surface, the frequency typically increases. This can happen during desorption, degradation, enzymatic cleavage, rinsing, dissolution, or film removal. (For soft or viscoelastic layers, where Δf does not directly convert to mass via the Sauerbrey relation, see the modeling note below.)
The dissipation shift provides information about the softness or viscoelastic character of the layer. A higher dissipation signal generally indicates a softer, more hydrated, or more viscoelastic layer. A lower dissipation signal generally indicates a more rigid or compact layer.
Together, Δf and ΔD can be used to extract information about:
For thin, rigid, and laterally homogeneous films, the mass can often be estimated using the Sauerbrey relation. For softer, thicker, or more hydrated layers, viscoelastic modeling is typically more appropriate to obtain quantitative mass and thickness information.
QCM-D can be used to study many types of surface-bound molecules and thin films, including:
Because QCM-D senses the total coupled mass, including associated solvent, it is especially useful for soft and hydrated layers where the amount of water or solvent in the film is part of the functional behavior.
As an example of a mass measurement, consider a biotinylated supported lipid bilayer exposed to an anti-biotin antibody. The aim is to detect antibody binding to the surface and then follow enzymatic cleavage of the antibody using the enzyme IdeS.
1. Establish the reference surface: A biotin-tagged supported lipid bilayer is first formed on the sensor surface. This lipid bilayer acts as the reference surface for the experiment.
2. Introduce the antibody: An anti-biotin antibody solution is then flowed over the bilayer. As the antibody binds to biotin at the surface, QCM-D records a mass uptake.
The binding continues until the surface approaches saturation. In this example, the final mass uptake is approximately 1100 ng/cm², Fig. 1.
3. Introduce the enzyme: Next, the enzyme IdeS is introduced. IdeS cleaves the anti-biotin antibody, and this cleavage is expected to remove part of the antibody mass from the surface.
As expected, the QCM-D measurement shows a decrease in mass density after the enzyme is introduced. The mass decreases by approximately 30%, which agrees well with the expectation that about one third of the antibody molecule is removed.
This example demonstrates how QCM-D can detect both molecular binding and enzymatic cleavage in the same experiment. The measurement provides insight into the binding process, verifies enzyme activity, and can also provide information about the orientation or accessibility of the antibody at the surface.
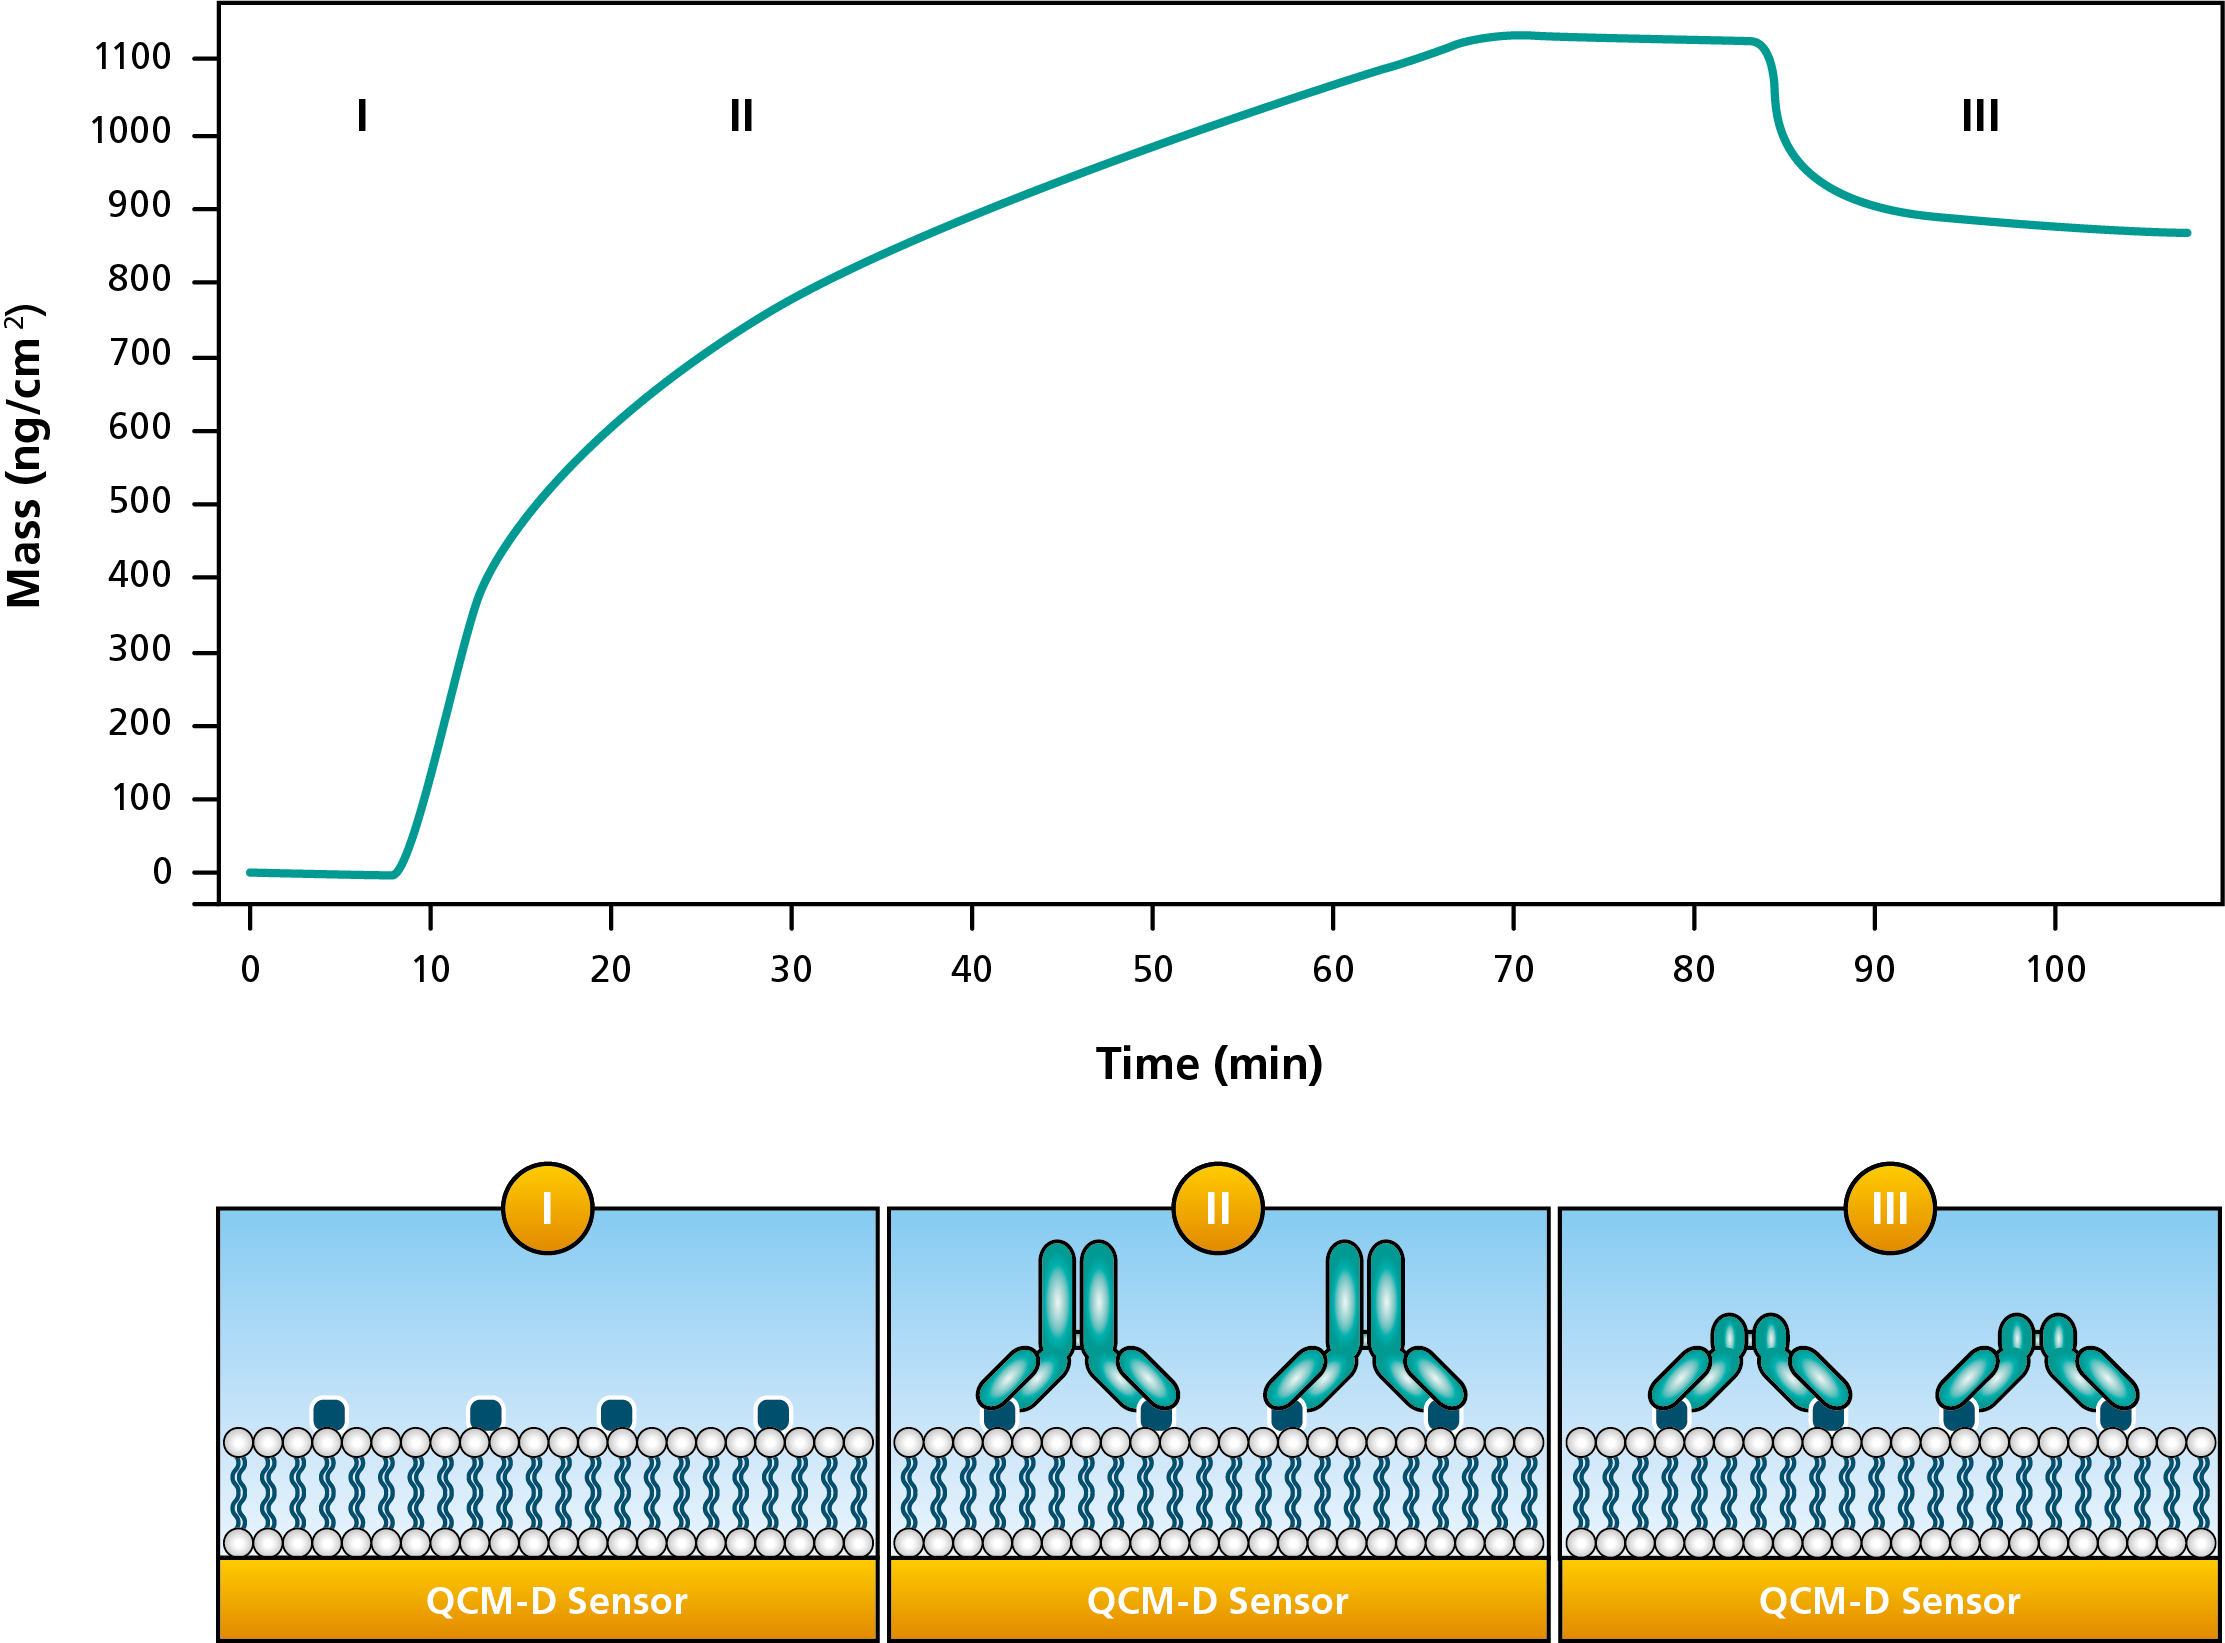
Figure 1. Mass changes as an antibody binds to the biotinylated bilayer on the surface (I-II) followed by enzymatic cleavage (III) that approximately one third of the mass at the surface.
A typical QCM-D workflow for measuring mass and thickness changes includes the following steps.
1. Prepare the sensor surface
The sensor is coated with a material relevant to the system being studied. Typical sensor surfaces include metals, silica, glass-like materials, polymers, and other functional coatings. The molecule or thin film of interest is then formed or adsorbed on the sensor surface, depending on the experiment.
2. Establish a stable baseline
Before introducing the sample or trigger condition, the sensor is equilibrated in a defined background medium, such as buffer, water, solvent, or controlled humidity. A stable baseline in both frequency and dissipation is important for reliable interpretation of mass and thickness changes.
3. Introduce the sample or condition of interest
The surface is exposed to the molecule, compound, formulation, or environmental condition that initiates the process of interest. This could be an adsorbing molecule, a rinsing solution, an enzyme, a change in pH, a change in salt concentration, or a temperature shift.
4. Monitor Δf and ΔD in real time
Throughout the experiment, the instrument records changes in resonance frequency and dissipation. These signals reveal how the layer changes over time. The measurement can show whether material is added to or removed from the surface, whether the layer becomes softer or more rigid, and whether the process occurs rapidly, gradually, or in multiple stages.
5. Analyze mass, thickness, and layer properties
Depending on the properties of the film, the data can be analyzed using a rigid-film model, i.e. the Sauerbrey relation, or a viscoelastic model. This can provide quantitative information about mass, thickness, and mechanical properties of the surface-bound layer.
Mass and thickness measurements are relevant in many research and development areas involving thin films and surfaces.
Adsorption and molecular binding: Mass uptake can reveal when molecules bind to or adsorb onto a surface. This is useful for studying protein binding, antibody-antigen interactions, DNA hybridization, lipid interactions, and other biomolecular processes.
Desorption and removal: Mass loss can reveal when material leaves the surface, for example during desorption, rinsing, enzymatic cleavage, dissolution, degradation, or cleaning.
Thin film formation and multilayers: Mass and thickness changes can be used to monitor the build-up of polymer films, polyelectrolyte multilayers, lipid layers, and other molecular architectures.
Swelling, collapse, and hydration changes: Because QCM-D is sensitive to hydrated mass, it can reveal when a layer takes up or releases solvent, swells, collapses, or changes its hydration state.
Coatings and surface treatments: Mass and thickness data can help characterize coating deposition, stability, removal, and response to environmental changes.
Degradation and film stability: QCM-D can monitor how films lose mass or thickness during degradation, enzymatic action, etching, dissolution, or rinsing. This makes it possible to evaluate both the rate and extent of film degradation.
Formulation and product development: The technique can be used to compare how different formulations, additives, surfactants, or process conditions influence surface interactions and film properties.
Assuming mass is always dry mass
QCM-D measures mass coupled to the sensor surface oscillation. This include both the molecules at the surface and associated solvent. This is especially important for soft, hydrated, or porous layers.
Ignoring dissipation
Frequency alone provides information about mass changes when the layer fulfils the criteria of the Sauerbrey relation. Dissipation reveals whether the assumptions are valid. For many thin films, both signals are needed.
Using the wrong model
The Sauerbrey relation is useful for thin, rigid, and homogeneous films. For soft or hydrated layers, viscoelastic modeling is often needed to obtain meaningful mass and thickness estimates.
Not allowing the baseline to stabilize
A drifting baseline can make it difficult to separate true adsorption, desorption, or thickness changes from instrumental or environmental effects.
Comparing final values only
The pathway to the final state can be as important as the final mass or thickness. Time-resolved data can reveal intermediate steps, rates, rearrangements, and reversibility.
Mass and thickness are key parameters for understanding how thin films and molecular layers form, change, and degrade at surfaces. In many cases, the real value of these measurements is not the mass or thickness value alone, but what the changes reveal about the interfacial process taking place. QSense QCM-D monitors these changes in real time by tracking shifts in resonance frequency, Δf, and dissipation, ΔD, of a quartz crystal sensor. By combining mass and thickness information with dissipation data, QCM-D provides insight not only into how much material is present at the surface, but also into how the layer behaves mechanically and structurally. This makes it possible to follow adsorption, desorption, binding, enzymatic cleavage, swelling, collapse, film build-up, and film degradation as they happen.
Download the overview to read more about what information you can obtain with QSense QCM-D and how it can be used to study mass, thickness, viscoelasticity, and other interfacial phenomena.


Malin graduated in engineering physics in 2006, where her research focused on the QCM-D technology. Since then, she has been scrutinizing the how’s and why’s of the world in general, and the world of QCM-D in particular.
