
Apart from using the energy dissipation factor in QCM-measurements, it is possible to gain even more information from a viscoelastic sample by monitoring multiple overtones. In this post, we take a closer look at what information the overtones offer. We are considering theoretical polymer layers with various thicknesses.
According to the laws of physics, the penetration depth of the acoustic shear wave, δ, in a liquid, or soft medium, will decrease as the shear oscillation frequency increases

where η and ρ are the viscosity and density of the medium, and ω is the angular frequency. As a direct result of Eq. 1, different overtones will respond differently to a soft matter material sample layer on top of the sensor surface. Just like different impinging angles and wavelengths in optical measurement methods, different overtone numbers provide slightly different perspective of the sample material. An analogy is that when one is observing a three-dimensional object, Fig 1., one needs to look at it from different angles in order to get a complete picture of its appearance. Observation from only one angle will provide an incomplete picture that even might fool the observer and give a misleading depiction of the object.
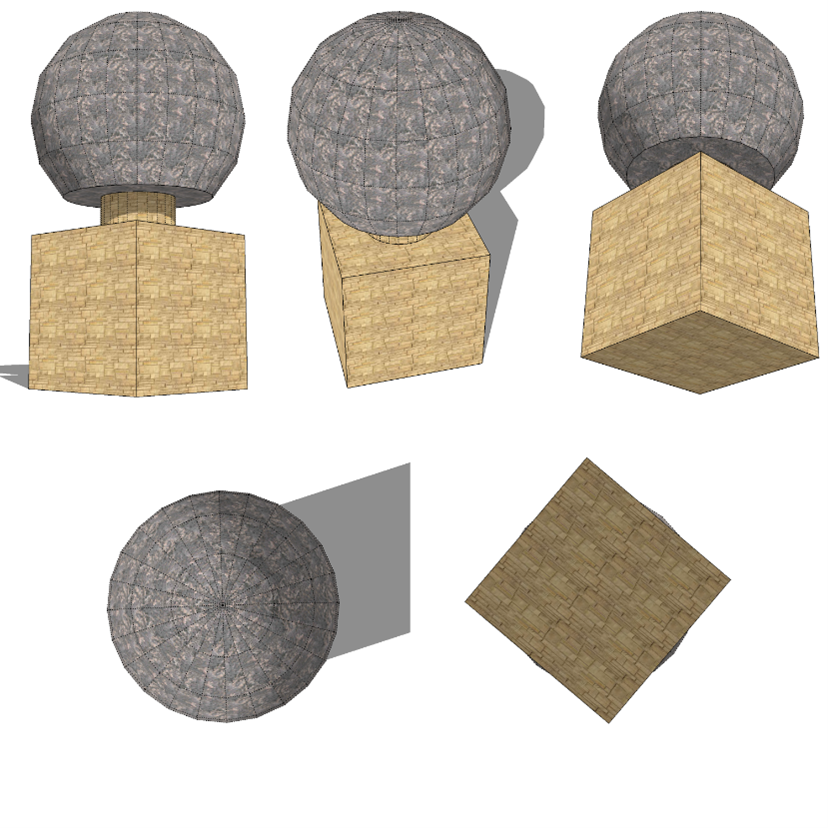
Figure 1. An illustration of a three-dimensional object shown from different angles.
An inherent property of a piezoelectric resonator is that the oscillation amplitude at the sensor surface decreases with increasing overtone number, Fig. 2. As the sensor load increases (in this example via an increasing film thickness), the amplitude decreases in a similar way as Δf and ΔD decreases respectively increases.
For a certain film thickness, a dip in maximum oscillation amplitude can be observed, Fig. 2. The thickness at which this happens corresponds to the maximum antiphase between the emitted and reflected shear waves, and it will therefore vary with the overtone number.
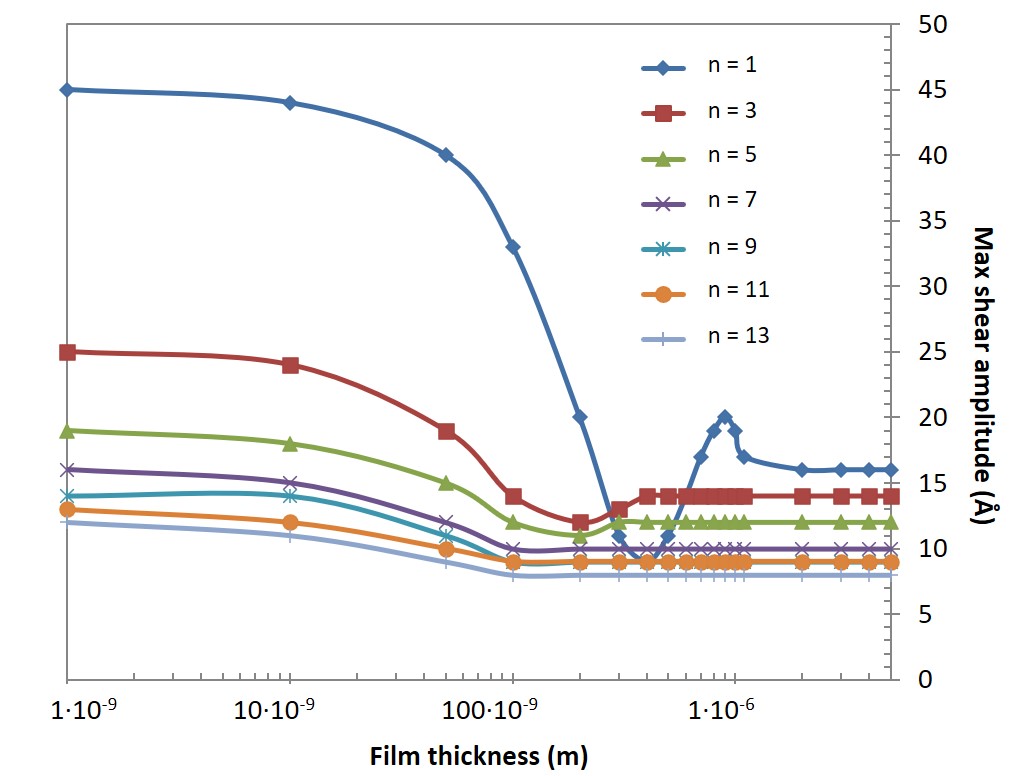
Figure 2 Modelled maximum shear oscillation amplitude at the sensor surface, for the respective harmonics n = 1, 3, 5, 7, 9, 11, and 13, as a function film thickness. The plot shows that the maximum oscillation amplitude at the sensor surface decreases with increasing overtone number. It also shows that, at a certain film thickness, there will be a dip in the amplitude. The dip corresponds to the maximum antiphase between the emitted and reflected shear waves.
This phenomenon will also be clear if one is considering the shear wave oscillation amplitude throughout the film for different film thicknesses, Fig. 3.
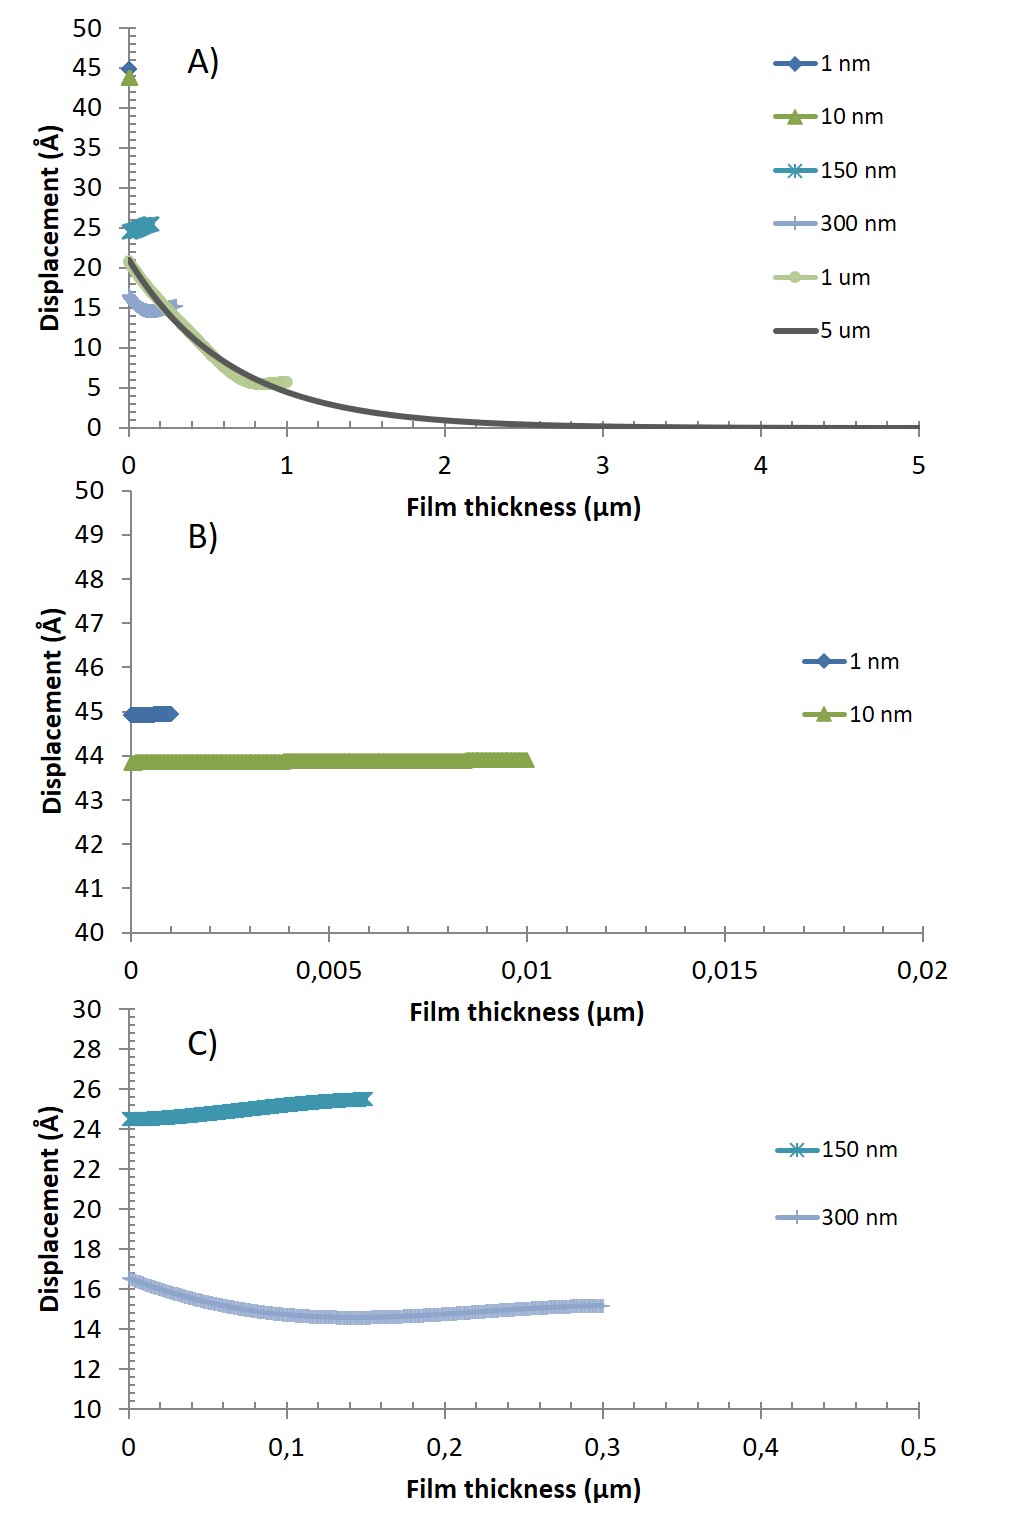
Figure 3. Modelled shear wave oscillation amplitude, for the fundamental frequency, throughout films of various thicknesses, 1 nm, 10 nm, 150 nm, 300 nm, 1 μm, and 5 μm, respectively. Plot A) shows all thicknesses. Plot B) is a zoom in of A) to highlight the behavior of the 1 nm and 10 nm films. Plot C) is a zoom in of A) to highlight the behavior of the 150 nm and 300 nm films.
As mentioned earlier, the displacement, as well as the extinction depth, become smaller with increasing overtone number (c.f. Fig. 2). However, the general behavior is equivalent to what can be observed in Fig. 3 for the fundamental frequency.
Since lower resonances sense a larger coupled mass, the corresponding responses of Δf and ΔD are generally larger in the case of a laterally homogenous film, Fig. 4.
Both the acoustic penetration depth, δ, and the wavelength decrease with increased frequency as described above. As a result, the superposition effects will be shifted, and the peak in frequency and energy dissipation (maximum antiphase) will occur earlier, i.e. at lower thickness, with increased overtone number.
In the case of a rigid film, i.e. for low Δf and ΔD in the example given here, the f and D curves for all overtones overlap since the viscoelastic response is insignificant, Fig. 4. But when the softness increases, or the thickness in the case here, there will be a clear separation of the overtones due to the difference in penetration depth and wavelength.
As the thickness of the film increases above δ, the Δf and ΔD responses eventually stabilize at constant values. Any added material from here will not be sensed and therefore not contribute to Δf and ΔD.
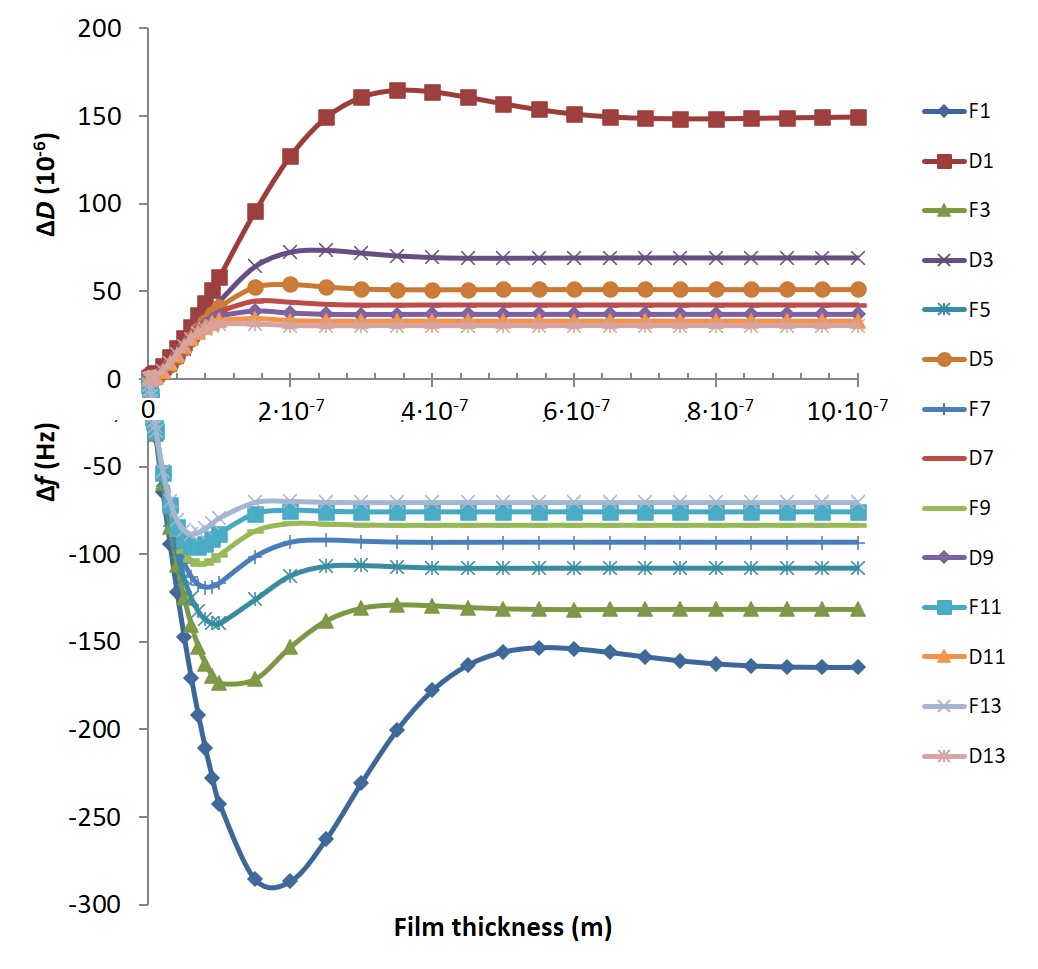
Figure 4. Δf and ΔD responses for the different overtones as a function of film thickness. For thin films, all the overtones overlap, which indicates that the viscoelastic response is insignificant. As the film thickness increases, the overtones separate.
When plotting the energy dissipation shift, ΔD, as a function of the frequency shift, Δf, for the different overtones, the difference in viscoelastic response becomes clearer, Fig. 5. The spiral characteristics originating from the reflection and superposition of shear waves in the soft film results in the fact that one specific value of ΔD may correspond to two, three or even four different Δf values.
In the spiral, an increased mass load might result in an increased Δf instead of a decrease, which would be expected from a rigid film. A soft film is characterized by not only the mass or thickness but also the viscosity and the elastic moduli. Using only one overtone (i.e. two input parameters, Δf and ΔD) will thus not give sufficient information to characterize the viscoelastic properties of the system. For different overtones, the spiral is characterized by different values of Δf and ΔD and they will therefore provide necessary complementary information to fully understand the behavior of the system.
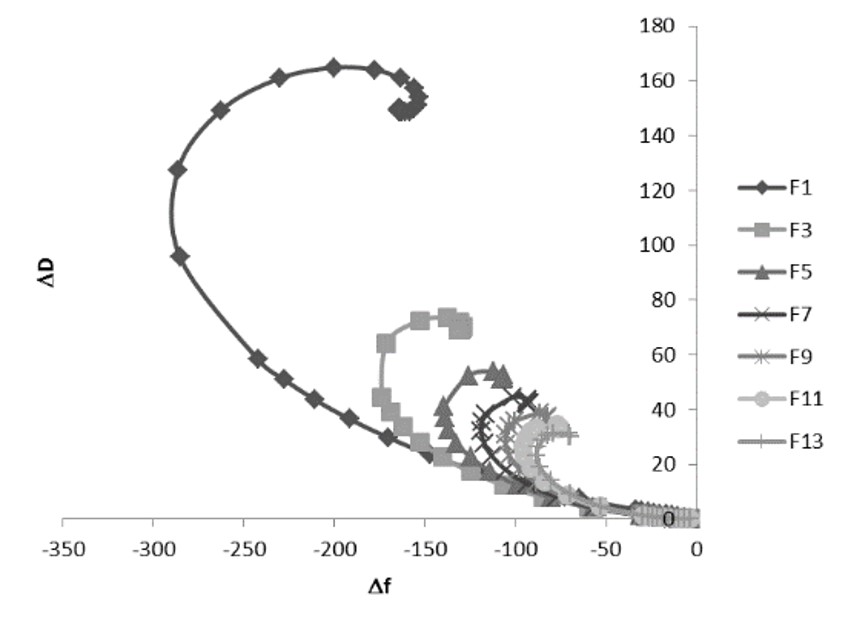
Figure 5. The energy dissipation shift, ΔD, plotted as a function of the frequency shift, Δf, for the different overtones. Plotting the data this way, it is clear that one specific value of ΔD may correspond to two, three or even four different Δf values.
The amplitude and the superposition effect look different for different overtones as well as the Δf and ΔD responses. This once again brings us back to the illustration in Fig. 1, which serves an analogy of the fact that the overtones will provide different perspective of the sample in contact with the sensor surface. Mathematically, it is also required to have at least as many input parameters as output parameters in the viscoelastic model. For a soft adlayer, the output parameters are mass/thickness, viscosity, and elasticity.
Want to save the text for later? Download the text as pdf below
Learn how QSense QCM D can be used to analyze swelling of thin films, including magnitude and dynamics.
Read about how molecule-surface interaction processes such as adsorption and desorption can be analyzed with QCM-D.
Learn best practices and step-by-step methods for accurate QCM-D coating thickness measurement on QSense sensors using QSense Omni.
Compared to QCM, QCM-D measures an additional parameter, and provides more information about the system under study.
Discover how QCM-D analysis reveals real-time etching dynamics, helping optimize cleaning processes and protect surfaces from unwanted damage.
Discover how QSense QCM-D helps tackle fouling challenges across industries
Discover how QCM-D enables real-time, label-free analysis of supported lipid membrane formation, structure, and dynamics for advanced research
Learn how QSense QCM-D analysis can reveal membrane fouling dynamics and optimize cleaning strategies for more efficient water treatment
Learn how QSense QCM-D helps detect and prevent surface-induced instabilities in biologics. Join our webinar for insights and practical examples.
Learn about the top QSense sensors for analyzing biopharmaceutical drug-surface interactions in the context of IV bags.
Learn about QCM-D, Quartz Crystal Microbalance with Dissipation monitoring - an analytical tool for surface interaction studies at the nanoscale.
Gabriel Ohlsson, Ph.D., is a former employee at Biolin Scientific where he initially held a position as an application scientist and later as a sales manager. Dr. Ohlsson did his Ph.D. in engineering physics and has spent a lot of time developing sensing technologies for soft matter material applications. One of his main tools during this research has been the QCM-D technology.
