How much does a layer of molecules weigh? Mass is a property which has been of interest to man for thousands of years. Starting with an interest in weighing precious amounts of gold, we have sought to quantify the mass of objects spanning the entire size range, from electrons to galaxies, as well as everything both beyond and between. Needless to say, the weighing approach depends on the size of the body to be weighed. At the ‘nano’ end of the scale, the mass of thin films can be assessed by for example ellipsometry and QCM, two commonly used surface sensitive techniques able to measure small quantities. The mass values extracted by the two techniques are however often not the same. So, what is the difference between these masses, and why are they not equal?
The answer to what is the difference between the ellipsometry mass and the QCM mass lies in the physical principle of the measurement. Ellipsometry is an optical technique whereas QCM is an acoustic one. Ellipsometry measures optical changes, changes of a light signal, while QCM measures acoustic changes, changes of a sound signal. So, the question is how does the mass in the film interact with light waves and how does it interact with sound waves?
In brief, light consists of electromagnetic waves traveling through media. The wave will be affected by changes of the optical properties along the path of propagation, and an optical method will sense changes of these properties, typically measured relative to a background medium. Ellipsometry, for example, senses changes in refractive index when molecules adsorb to the sensor surface.
Sound, which is a mechanical wave traveling through media, behaves differently than light waves. As the sound wave propagates, the molecules in the medium will move. The mechanical properties of the medium will determine how easy or how difficult it is for the sound wave to travel. An acoustic method will sense changes of the mechanical properties of the moving medium, measured relative to a reference. QCM, for example, senses when molecules adsorb to the sensor surface and also when adsorbed molecules change conformation.
As discussed above, both ellipsometry and QCM senses molecular mass changes. Ellipsometry, however, measures mass excluding the associated solvent whereas QCM measures mass including the associated solvent. This is the reason why optical mass is often referred to as “dry mass” and acoustic mass often referred to as “wet mass”.
As an example, let’s take a look at the schematic scenario in Figure 1. When the molecules lie down on the surface, they will couple a small amount of solvent, whereas they will couple a larger amount of solvent when standing up. The number of molecules at the surface is the same in the two cases, they are just arranged in different ways and hence the amount of coupled solvent differs. The optical technique, which measures the ‘dry’ mass and which doesn’t ‘see’ the liquid, will register the same amount of mass in the two scenarios. The acoustic technique, on the other hand, ‘sees’ both the molecules and the solvent i.e. the ‘wet’ mass and will register a larger mass in the swollen state than in the collapsed one.
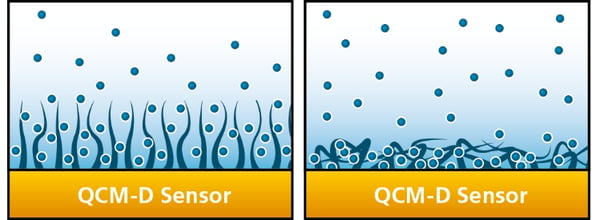
Figure 1. Schematic illustration showing two different scenarios with the same number of molecules at the surface in two different configurations. The configuration to the left allows a large amount of solvent to be trapped, while the configuration to the right traps a small amount of solvent.
Ellipsometry and QCM provide complementary information. Download our application note to read more about how they can be combined for a simultaneous characterization of the hydrated and non-hydrated masses.
Malin graduated in engineering physics in 2006, where her research focused on the QCM-D technology. Since then, she has been scrutinizing the how’s and why’s of the world in general, and the world of QCM-D in particular.