There is a measurement setup that allows for efficient investigation and characterization of thin film build-up, as well as monitoring of structural behavior as a function of variations in the surrounding environment such as surface material, salt concentration, pH, temperature etc. Despite their very different operating principles, in several ways quartz crystal microbalance with dissipation monitoring (QCM-D) and spectroscopic ellipsometry (SE) are kindred spirits.
Both can:Also, they can measure the same sample at the same time. Yet the information each instrument provides is sufficiently distinct such that when one considers the results of both instruments, the whole can be greater than the sum of the parts, and offers a synergistic effect.
Thin film characterization with Quartz Crystal Microbalance with Dissipation monitoring
QCM-D is a mechanical or acoustical technique which enables the characterization of the thickness, mass, and viscoelastic properties of thin films on a surface in real-time.
So how does it work? The technology is based on the measurement of the oscillation frequency of a piezoelectric sensor, onto which the molecules adsorb and form a thin film. The shifts of the oscillation frequency and its odd-numbered harmonic overtones are related to the attachment or detachment of material to the sensor surface. As material attaches, the resonance frequency decreases. Additionally, the sensor is operated under a “ring-down” method, whereby the driving voltage is periodically cut. The rates of the oscillation amplitude decay for the harmonic overtones are measured and quantified as the dissipation parameters. The dissipation shifts are related to changes in the viscoelasticity of the experimental system. As the system becomes more viscoelastic (i.e., lossy, softer), the dissipation increases.
With a set of frequency and dissipation data, collected from multiple harmonics, a viscoelastic model can be applied, enabling the calculation of the thickness and mechanical properties of the thin film.
Spectroscopic2 ellipsometry (SE) is an optical technique which enables characterization of optical properties, such as refractive index, and thickness of thin films in real-time.
So how does it work? The technology is based on the measurement of polarized light which is reflected off or transmitted through a sample and collected by a detector. SE measures the change in the polarization state of the light from before and after sample interaction, and this change is quantified by the ellipsometric parameters Ψ and Δ. Ψ is related to the relative amplitudes of the orthogonal components of the probing light beam, and Δ is related to the phase difference between the components. Ψ and Δ are measured at multiple wavelengths, and some commercially available instruments measure thousands of wavelengths simultaneously.
For a dynamic SE measurement, Ψ and Δ shifts δΨ and δΔ are considered together in an optical model to yield the thickness and optical properties of thin films.
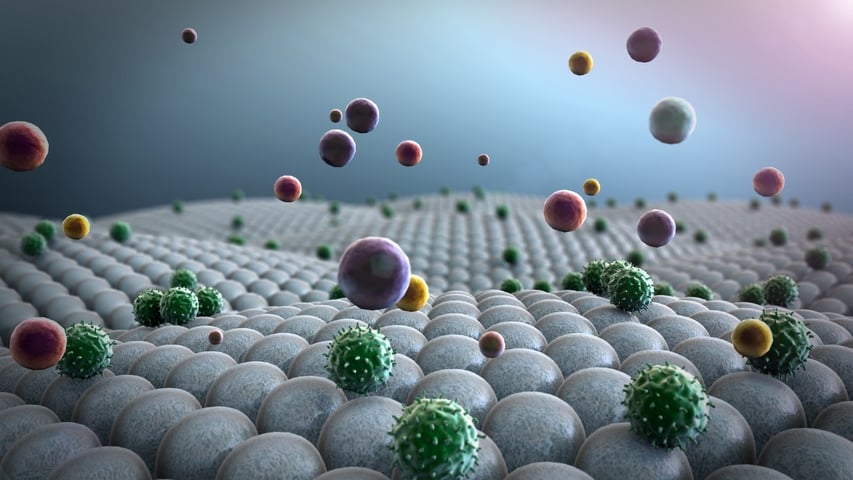
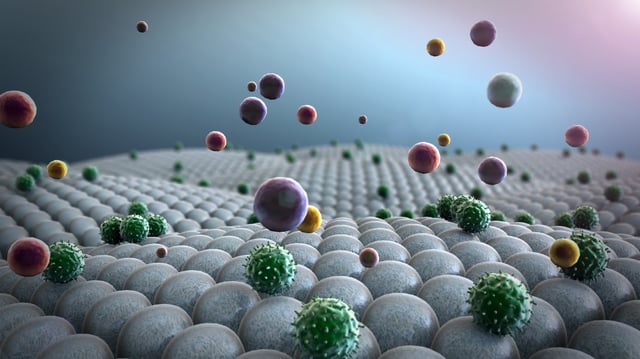
The QCM-D is sensitive not only to adsorbate materials but also to the ambient liquid that mechanically couples to the adsorbate and oscillates with the adsorbate and sensor surface. i.e., QCM-D senses the “wet mass.” On the other hand, Spectroscopic ellipsometry can determine the mass of the adsorbate material while excluding the ambient liquid contribution. i.e., SE senses the “dry mass”. With information on both the “wet mass” and the “dry mass” of a thin layer, it is possible to determine the amount of coupled solvent and therefore the porosity of the layer, also referred to as the solvent volume fraction or the solvation content.
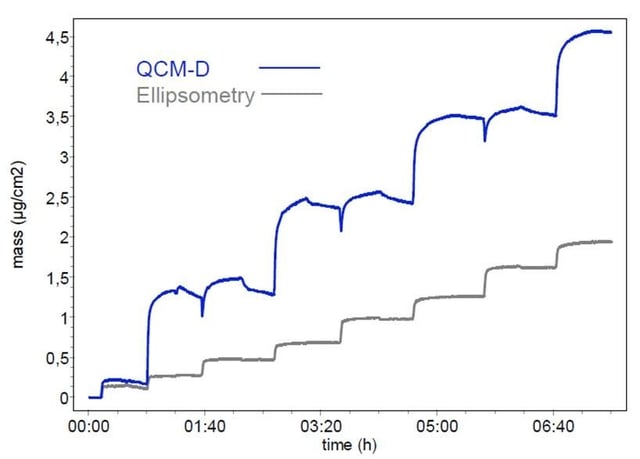 Figure 1: Surface mass density reported by QSense QCM-D (blue) and ellipsometry (grey). Data obtained by S. Stahl, J. Iturri Ramos, J. Zhou, S. Moya and R. Richter (CIC biomaGUNE, San Sebastian, Spain), in collaboration with Q-Sense AB, 2009
As an example, consider a layer-by-layer assembly process where positively and negatively charged polyelectrolytes are exposed over a surface. The surface mass uptake as a function of time is shown in Figure 1. The blue line is the QCM-D-obtained mass (adsorbate plus coupled water), and the grey line is the mass obtained from an ellipsometric measurement (adsorbate only). The QCM-D shows an alternating process where one polyelectrolyte forms a thick layer and the subsequent polyelectrolyte does not substantially change the surface mass. We don’t know how much of that mass is due to water rather than adsorbate. Therefore, we don’t know how effective the attachment of the subsequent polyelectrolyte was. On the other hand, SE shows a steady increase of the mass with each adsorbed layer. However, we don’t know how much water that the layer contains and how swollen it is, and the swelling state of a layer can be important for evaluating functionality.
By combining the data from both instruments, we get synergy and can extract more information on the structure of the layer during build-up.
In this way, we can monitor and quantify in more detail not only surface adsorption and desorption processes as a function of time, but we can also monitor and characterize the swelling and solvation state of an organic layer.
Brian Rodenhausen received his PhD from the University of Nebraska-Lincoln (UNL) Department of Chemical and Biomolecular Engineering in 2013. He specialized in combinatorial ellipsometry/QCM-D measurements and data analysis.