Thanks to the complementary information combinatorial QCM-D and ellipsometry can provide, these two techniques will allow you to simultaneously monitor both polymer brush swelling and deswelling behavior, as well as attachment and detachment of protein. It is also possible to separate these two influences on total interfacial adsorbate layer mass; processes which neither of the two techniques can do alone.
Smart surfaces are attractive in a wide range of applications such as sensing, biomaterials, tissue engineering, drug delivery, anti-fouling, and anti-icing surfaces, and even as nano-reactors [1]. Popular candidates in the development of such smart surfaces are stimuli-responsive polymer brushes. These change their conformation, wettability, or charge due to changes in pH, temperature, salt concentration, humidity in the local environment, which means that the polymer brush response can be tailored, optimized, and controlled.
For efficient design work, and to tailor the interfacial properties, it is important to characterize the polymer conformational behavior which influences, e.g., hydrophilicity/hydrophobicity and adsorption of molecules. One way to get this understanding is to monitor the polymer film thickness, as well as level of solvation, in contexts relevant for the intended use. By monitoring both the build-up and the functionality of these smart surfaces in a local environment, the brush-protein interaction can be explored, characterized and tuned.
In this open access publication by Bittrich et al [2], the swelling and protein adsorption mechanisms of the Guiselin polymer brushes of polyacrylic acid (PAA), which are pH sensitive and swell at higher pH, are followed and characterized by combinatorial QCM-D and spectroscopic ellipsometry (SE), which provide real-time information on both the “wet mass” and “dry mass.” With both pieces of information, the degree of swelling of the polymer brushes can be determined.
The Guiselin PAA brushes were formed on the QCM-D sensors with thin intermediary anchoring layers. Defatted bovine serum albumin protein (BSA) was then exposed to the brushes, and the adsorption and desorption behavior of the protein was controlled by the environmental pH.
In the publication, the following parameters are defined, where “SE” and “QCMD” refers to the method of detection that was used:
 is the difference between and and hence represents changes in the mass of coupled buffer
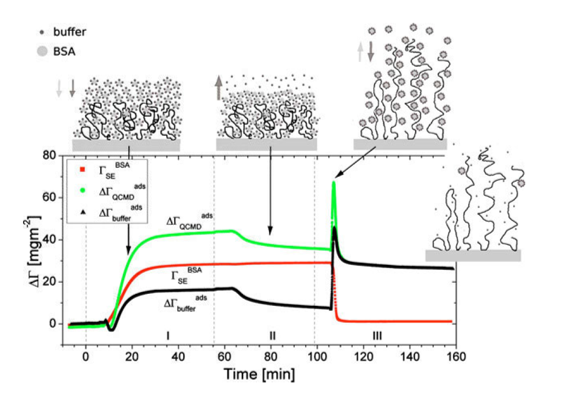 Figure. 1: Mass of BSA from ellipsometry (red line), BSA plus change in mechanically associated buffer (green line), and change in mechanically associated buffer (black line). In Region I, BSA is introduced at pH 5.2. In Region II, pH 5.2 buffer is rinsed through the ellipsometry module. In Region III, the pH is changed to 7.6, causing the brush to charge, swell, and repel the protein. Reproduced from E. Bittrich et al. Biointerphases 5, 159-167 (2010). dx.doi.org/10.1116/1.3530841
From the graph shown in Figure 1, the following polymer brush and protein interaction steps are summarized.
 stays constant, indicating that no BSA desorbs during the rinsing step; rather, some buffer is freed from the interfacial layer, which loses mass.
The combinatorial SE and QCM-D is ideal for separating and quantifying these two opposing processes -plummets to its initial value after the pH change; all the BSA is rapidly removed from the brush. At the same time, ![]() briefly spikes up and then returns to a value just below that at the end of the third step (end of Region II in Figure 1). The BSA mass loss is mostly offset by buffer incorporated into the swollen polymer brush. This is also shown by .Interestingly, transient behavior is also revealed by the QCM-D that implies that the brush swelling is faster than protein desorption.
briefly spikes up and then returns to a value just below that at the end of the third step (end of Region II in Figure 1). The BSA mass loss is mostly offset by buffer incorporated into the swollen polymer brush. This is also shown by .Interestingly, transient behavior is also revealed by the QCM-D that implies that the brush swelling is faster than protein desorption.
Learn more about the benefits of combined QCM-D and Spectroscopic ellipsometry (SE) and how it can be used to study layer build-up and thin film characterization.
Speaker: Brian Rodenhausen, PhD.
Brian Rodenhausen received his PhD from the University of Nebraska-Lincoln (UNL) Department of Chemical and Biomolecular Engineering in 2013. He specialized in combinatorial ellipsometry/QCM-D measurements and data analysis.

