- A complete analysis toolbox
One software for all your needs - Intuitive interface
Dfind supports you all the way through your analysis process - from data preparation to final reporting - Guided modelling
To take you through your analysis step by step - Material library
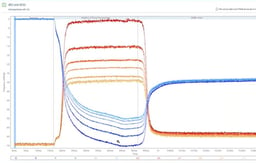
Configuring your modelling setup is easy, just select your sample material from the list - Autoplotting
Visualizes your results throughout the whole analysis - Smart tools
Dfind offers several analysis methods including shifts, rates and slopes to help you extract the information you need - Analyze all data in one go
To save your time, Dfind allows you to review, model and analyze multiple data sets in one go
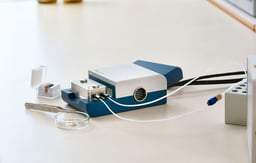
QCM-D
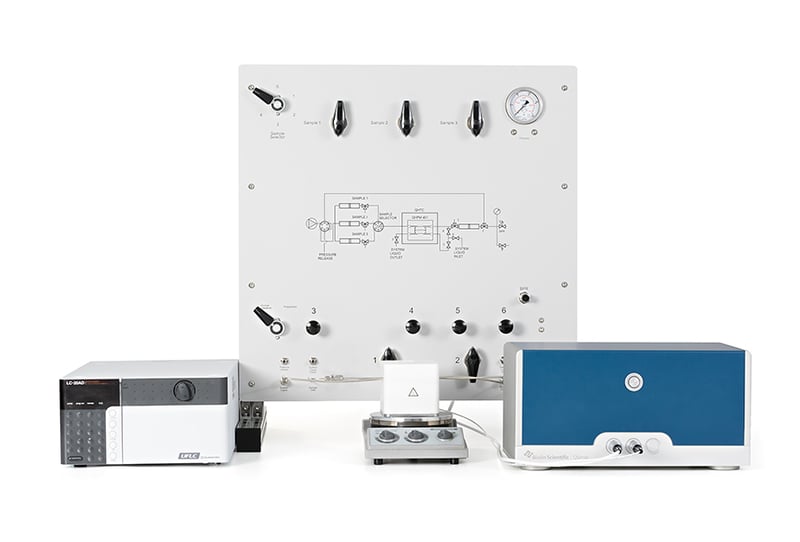
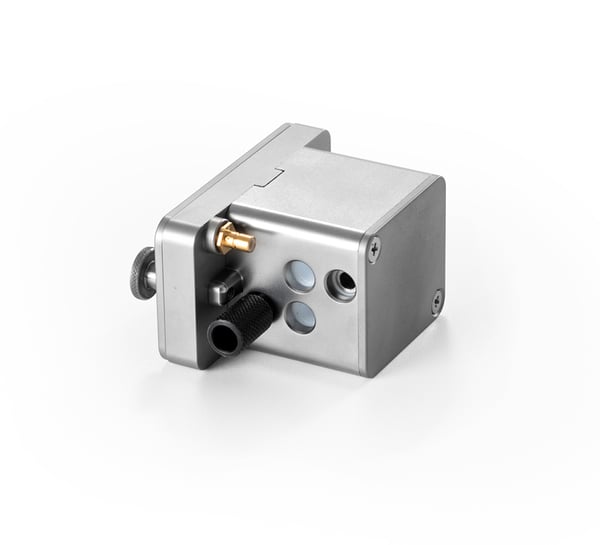
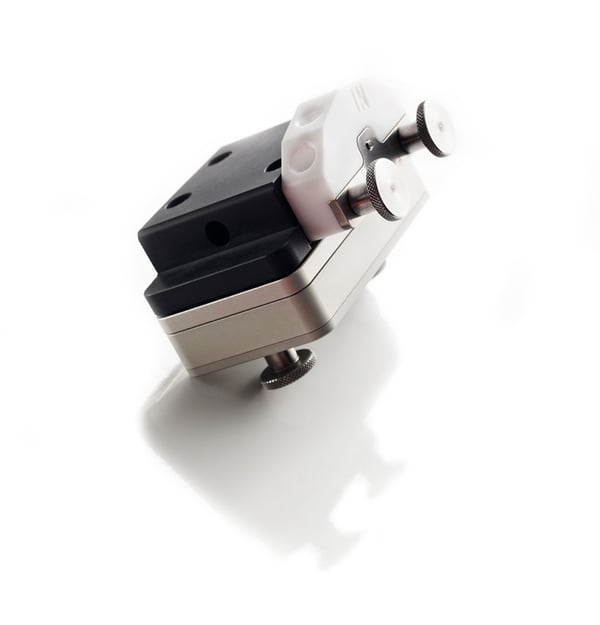
QSense High Pressure
The system provides you with the opportunity to study molecular interactions at surfaces and interfaces in real-time, exploring real-life conditions of high pressure and high temperature in your experimental set up.
In a hurry?
Discover QSense High Pressure and all of its advantages in this 3 minutes long video.
phenomena
-
 Adsorption
 -
 Desorption
 -
 Binding and interactions
 -
 Swelling
 -
 De-swelling, crosslinking and collapse
 -
 Degradation, corrosion and etching
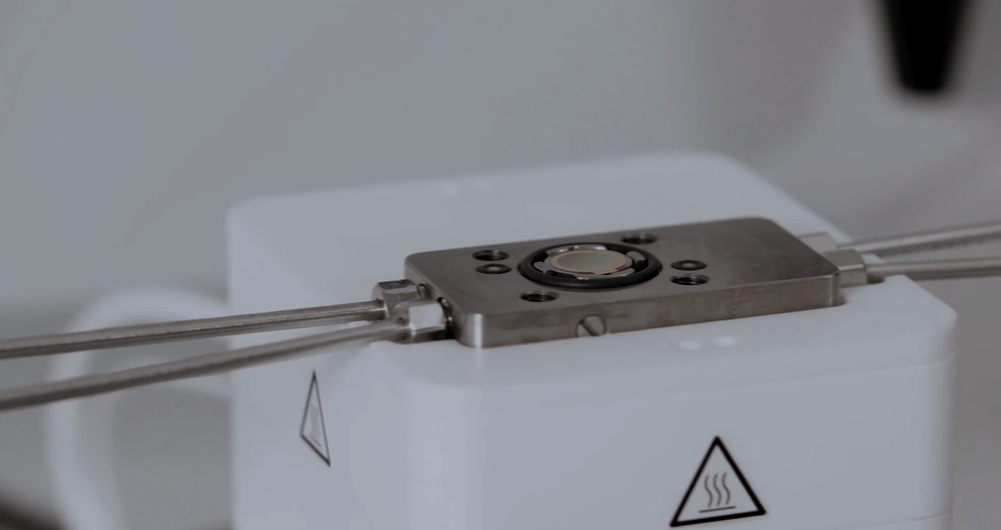
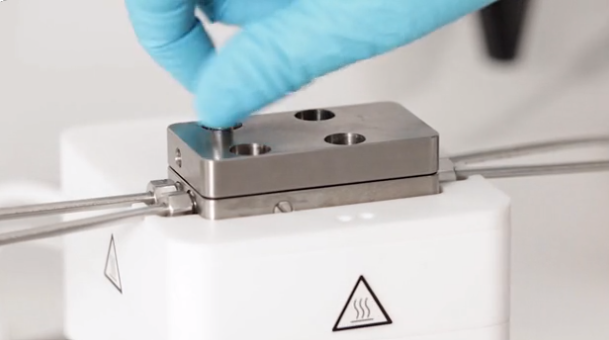
Measure in High Pressure & Temperature
Explorer High-Pressure environments
Study in High temperatures
Complete analysis set-up
QSOFT AND DFIND SOFTWARE
QSense software is tailored to help you maximize the potential of your QCM-D measurements. With QSoft capturing your data and Dfind simplifying your analysis, you can streamline your research process effortlessly.
measurement conditions
-
 Flow mode
 -
 Stagnant mode
 -
 Liquid phase
 -
 Harsh chemicals
 -
 Low temperature
 -
 High temperature
 -
 Variable pressure

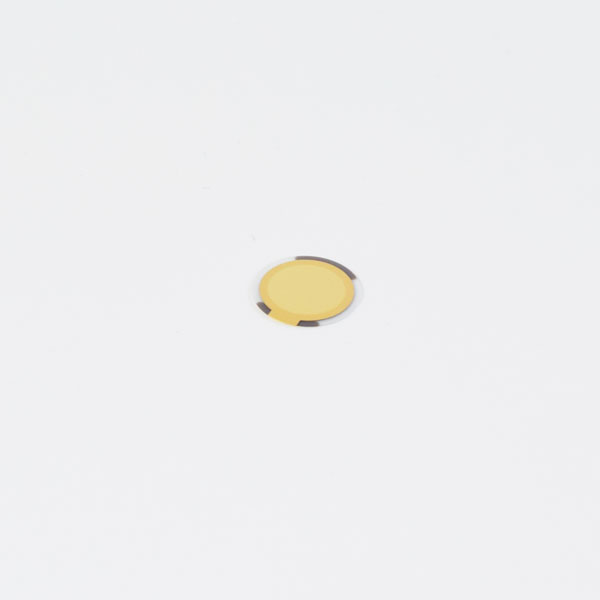
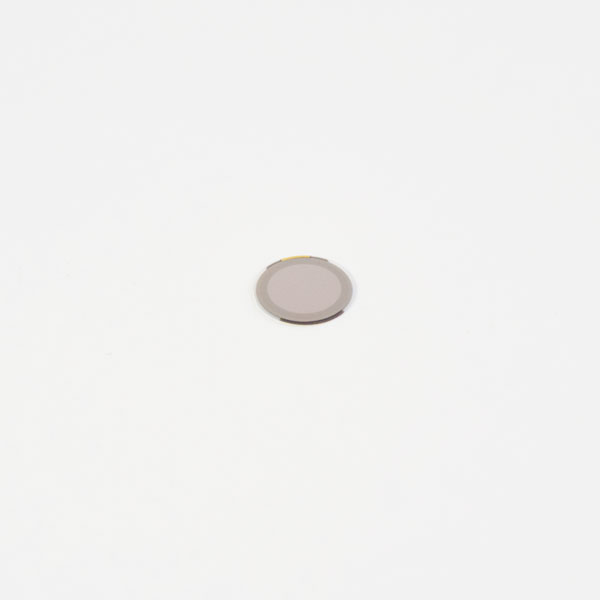
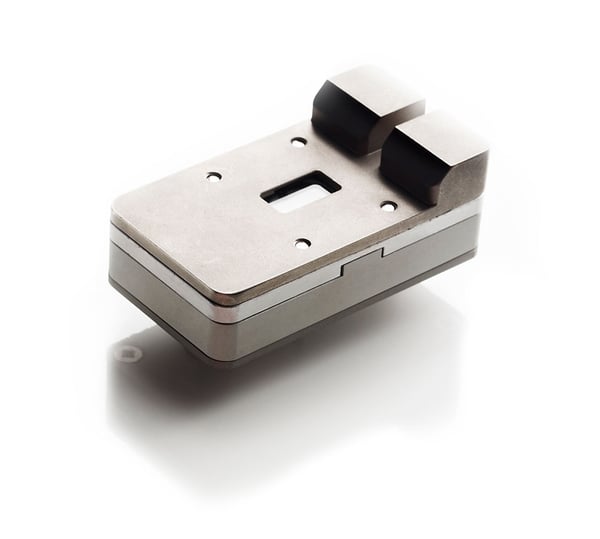
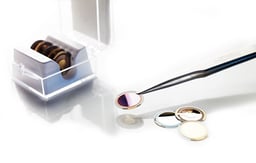
Standard sensors
The sensor is at the heart of the QCM-D experiment. Browse the widest range of sensors on the market to find out which sensor material and coating is best suited for your research.
We offer over 50 standard sensors - from various metals, oxides and carbides to polymers, functionalized coatings and and standardized soils. Our sensors are developed and produced to provide you with stable, reliable and reproducible data. Full performance is ensured through extensive quality controls and guaranteed for one-time use according to the recommendations.
Want the see more?

Would you like to know more about the details of Dfind and learn how the subscription works?

Electrochemistry Module
For simultaneous QCM-D and electrochemistry measurements on the same surface. Enables cyclic voltammetry and electrochemical impedance measurements to explore polymer behavior, electrostatic interactions, corrosion etc.
Ellipsometry Module
Enables simultaneous QCM-D and ellipsometry measurements on the same surface, which allows for quantification of solvent content in the film. It also gives a refined analysis of the morphological changes of the adsorbed film.
Window Module
The Window Module allows optical access to the sensor surface through a sapphire window. It enables experiments with UV-induced reactions and when used in the QSense Explorer chamber, the compact design also enables microscopy studies of reactions on the sensor.
The Ohio State University
Ohio State University, OSU, is the highest-ranked public university in Ohio and home to the Department of Food Science and Technology. The work of Prof. Dennis R. Heldman centers around food engineering, with emphasis on process design to achieve maximum efficiency and optimum food product quality.

Webinar
How Excipients, Surfaces and Formulation Conditions Affect Therapeutic Proteins
Go there

Webinar
Basics of QCM-D
Go there

Guide
How to Optimize the QCM-D Baseline Stability
Download
Overview
The Working Principles of QCM and QCM-D
Get it
Overview
QCM-D vs other QCMs
Get it
Overview
What is Piezoelectricity?
Get it

Overview
How QCM Results are Influenced by Layer Distribution
Get it

Overview
Why the Resonance Frequency of a QCM Sensor is 5MHz
Get it

Overview
Characterization of Polymer-based Systems
Get it
Webinar
Using QCM-D in the Food Industry
Go there
Overview
What is Biocompatibility?
Get it
Overview
Why it is Useful to use Multiple Overtones in QCM Measurements?
Get it
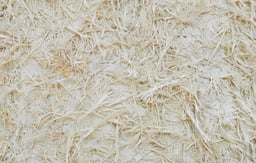
Webinar
Nanocellulose Research with QCM-D
Go there
Case Study
Analysis of Surfactant-Surface Interactions with QSense
Get it

Webinar
Getting Started with QSense Dfind
Go there

Guide
QCM-D Data Analysis
Download
Webinar
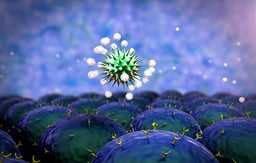
QCM-D as a Tool to Study the Binding of Viruses
Go there
Webinar
Characterization of Surfaces and Surface Reactions in Energy Storage
Go there

Guide
QSense Etching Guide
Download

Webinar
QCM-D Characterization of Antimicrobial Lipid Interactions with Supported Lipid Bilayers: Towards Antiviral Applications in the Biomedical and Agricultural Sectors
Go there

Overview
The Sauerbrey Relation
Get it
Overview
QCM-D Studies of Engineered Nanoparticles
Get it
Overview
Characterization of Biomolecular Interactions
Get it
Webinar
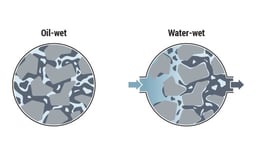
Working with QCM-D and Contact Angle Measurements under High Pressure - Oil and Gas Applications
Go there

Webinar
Adsorption and Aggregation of Monoclonal Antibodies at Silicone Oil-Water Interfaces
Go there
Overview
QSense Analysis in CMP
Get it

Overview
The Dissipation Factor in QCM-D Technology
Get it

Overview
Temperature Stability in QCM Measurements
Get it
Overview
What is Dissipation?
Get it
Overview
What is a Viscoelastic material?
Get it

Guide
How to Generate Quality QCM-D Data
Download

White Paper
QCM-D vs other QCMs
Download

List
QCM-D Publications in Battery Research
Get it
Guide
How to read a QCM Specification
Download
Webinar
Dfind Basic Training Course
Go there

Overview
Information Obtained with QSense QCM-D
Get it

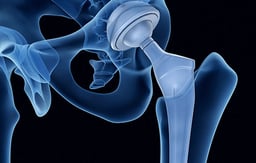
Webinar
Biomaterials – Man-made Materials for Regenerative Medicine
Go there