The Sauerbrey equation is well known to anyone working with QCM analysis. This linear equation converting frequency change to mass change is appealingly simple and straightforward to use. But you should only use it when the required conditions are met and the equations is valid. In this post we explain when this is.
So, you have run your QCM measurements and now it is time to analyze the data. You want to extract the mass and you know that there are two approaches, the Sauerbrey equation or viscoelastic modelling. So which approach should you use? The Sauerbrey equation is a tempting alternative. This linear equation converting the measured frequency shift to mass change by simple multiplication is appealingly simple and straightforward to use. But you are also aware that it is not always valid and when its not, it should not be used. So how do you know if you can use it or not?
If you have used QCM technology for some time, this is almost like a mantra - "the Sauerbrey equation is only valid for thin and rigid films". Why this is the case has been covered in several of our blog posts, for example this one. In brief, it is because the model assumes that the added layer can be approximated to be a part of the oscillating QCM crystal, and for this assumption to be valid, the layer on the sensor must be thin, rigid and firmly attached to the quartz crystal surface.
So, how do you know if your film is thin and rigid? If you are using multi-harmonic QCM-D, it is straightforward to assess if the layer formed at the sensor surface fulfills these criteria just by looking at the data. The key signature is low energy loss, i.e., ΔD close to zero, and overlapping harmonics, Fig. 1. These characteristic features of the data indicate that the impact of layer properties is negligibly small.
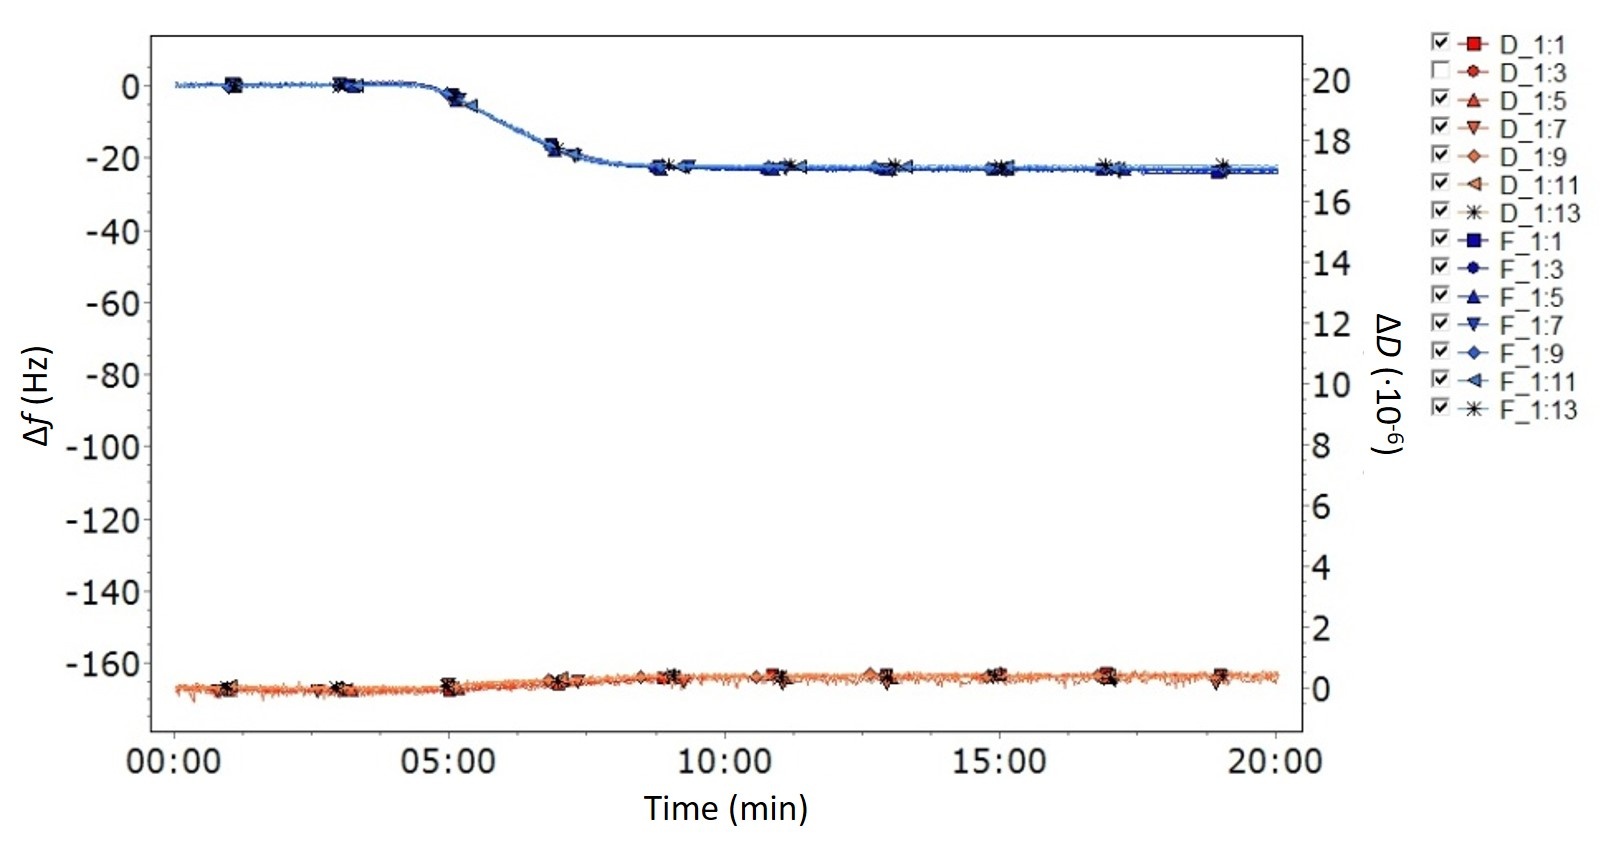 Figure 1. QCM-D data showing the characteristics of a thin and rigid layer - low dissipation and overlapping harmonics. The graph shows ΔD close to zero which means that the energy losses are small, and all the measured harmonics overlap to such an extent that it is almost difficult to see that more than one harmonic has been measured.
A common question is which harmonic that you should use for the calculation. The answer is that you should be able to use any harmonic. Since all the measured Δf:s ideally are overlapping the calculated mass will be the same irrespective of which harmonic you use. If the calculated mass is not the same irrespective of harmonic, this indicates that conditions for the Sauerbrey equation to be valid are not fulfilled, and then you need to use a model that better describes your layer, perhaps a viscoelastic model, for layer characterization.
The Sauerbrey equation is a simple and straightforward approach to quantify the QCM mass. For it to be valid however, the layer at the sensor surface must be thin and rigid and firmly attached to the sensor surface. If these conditions are not fulfilled, the calculated Sauerbrey mass will not be correct. Key signatures of the QCM-D data to look for are
If these conditions are fulfilled, you could use the Sauerbrey equation with confidence.
Download the guide below to learn more about when to use the Sauerbrey equation and when to use viscoelastic modelling, and what will be the consequences if you use the wrong approach.


Malin graduated in engineering physics in 2006, where her research focused on the QCM-D technology. Since then, she has been scrutinizing the how’s and why’s of the world in general, and the world of QCM-D in particular.