There is a wide variety of QCM:s available in the market. These range from standard QCM models to extended versions like QCM-D. Additionally, within these categories, there are single-harmonic and multi-harmonic instruments. Here we explain what that means and what the difference is between them.
QCM technology can monitor changes in mass, or thickness, of layers at the sensor surface by measuring changes in the resonance frequency of the quartz crystal upon excitation by a driving voltage.
A single harmonic QCM excites the crystal at one single frequency, typically the fundamental. A multi-harmonic QCM, on the other hand, excites the crystal at multiple frequencies. Typically, the fundamental frequency and one or several overtones are used. For a QCM to qualify as multi-harmonic, the number of frequencies measured needs to be more than one, but the number can vary from two and up.
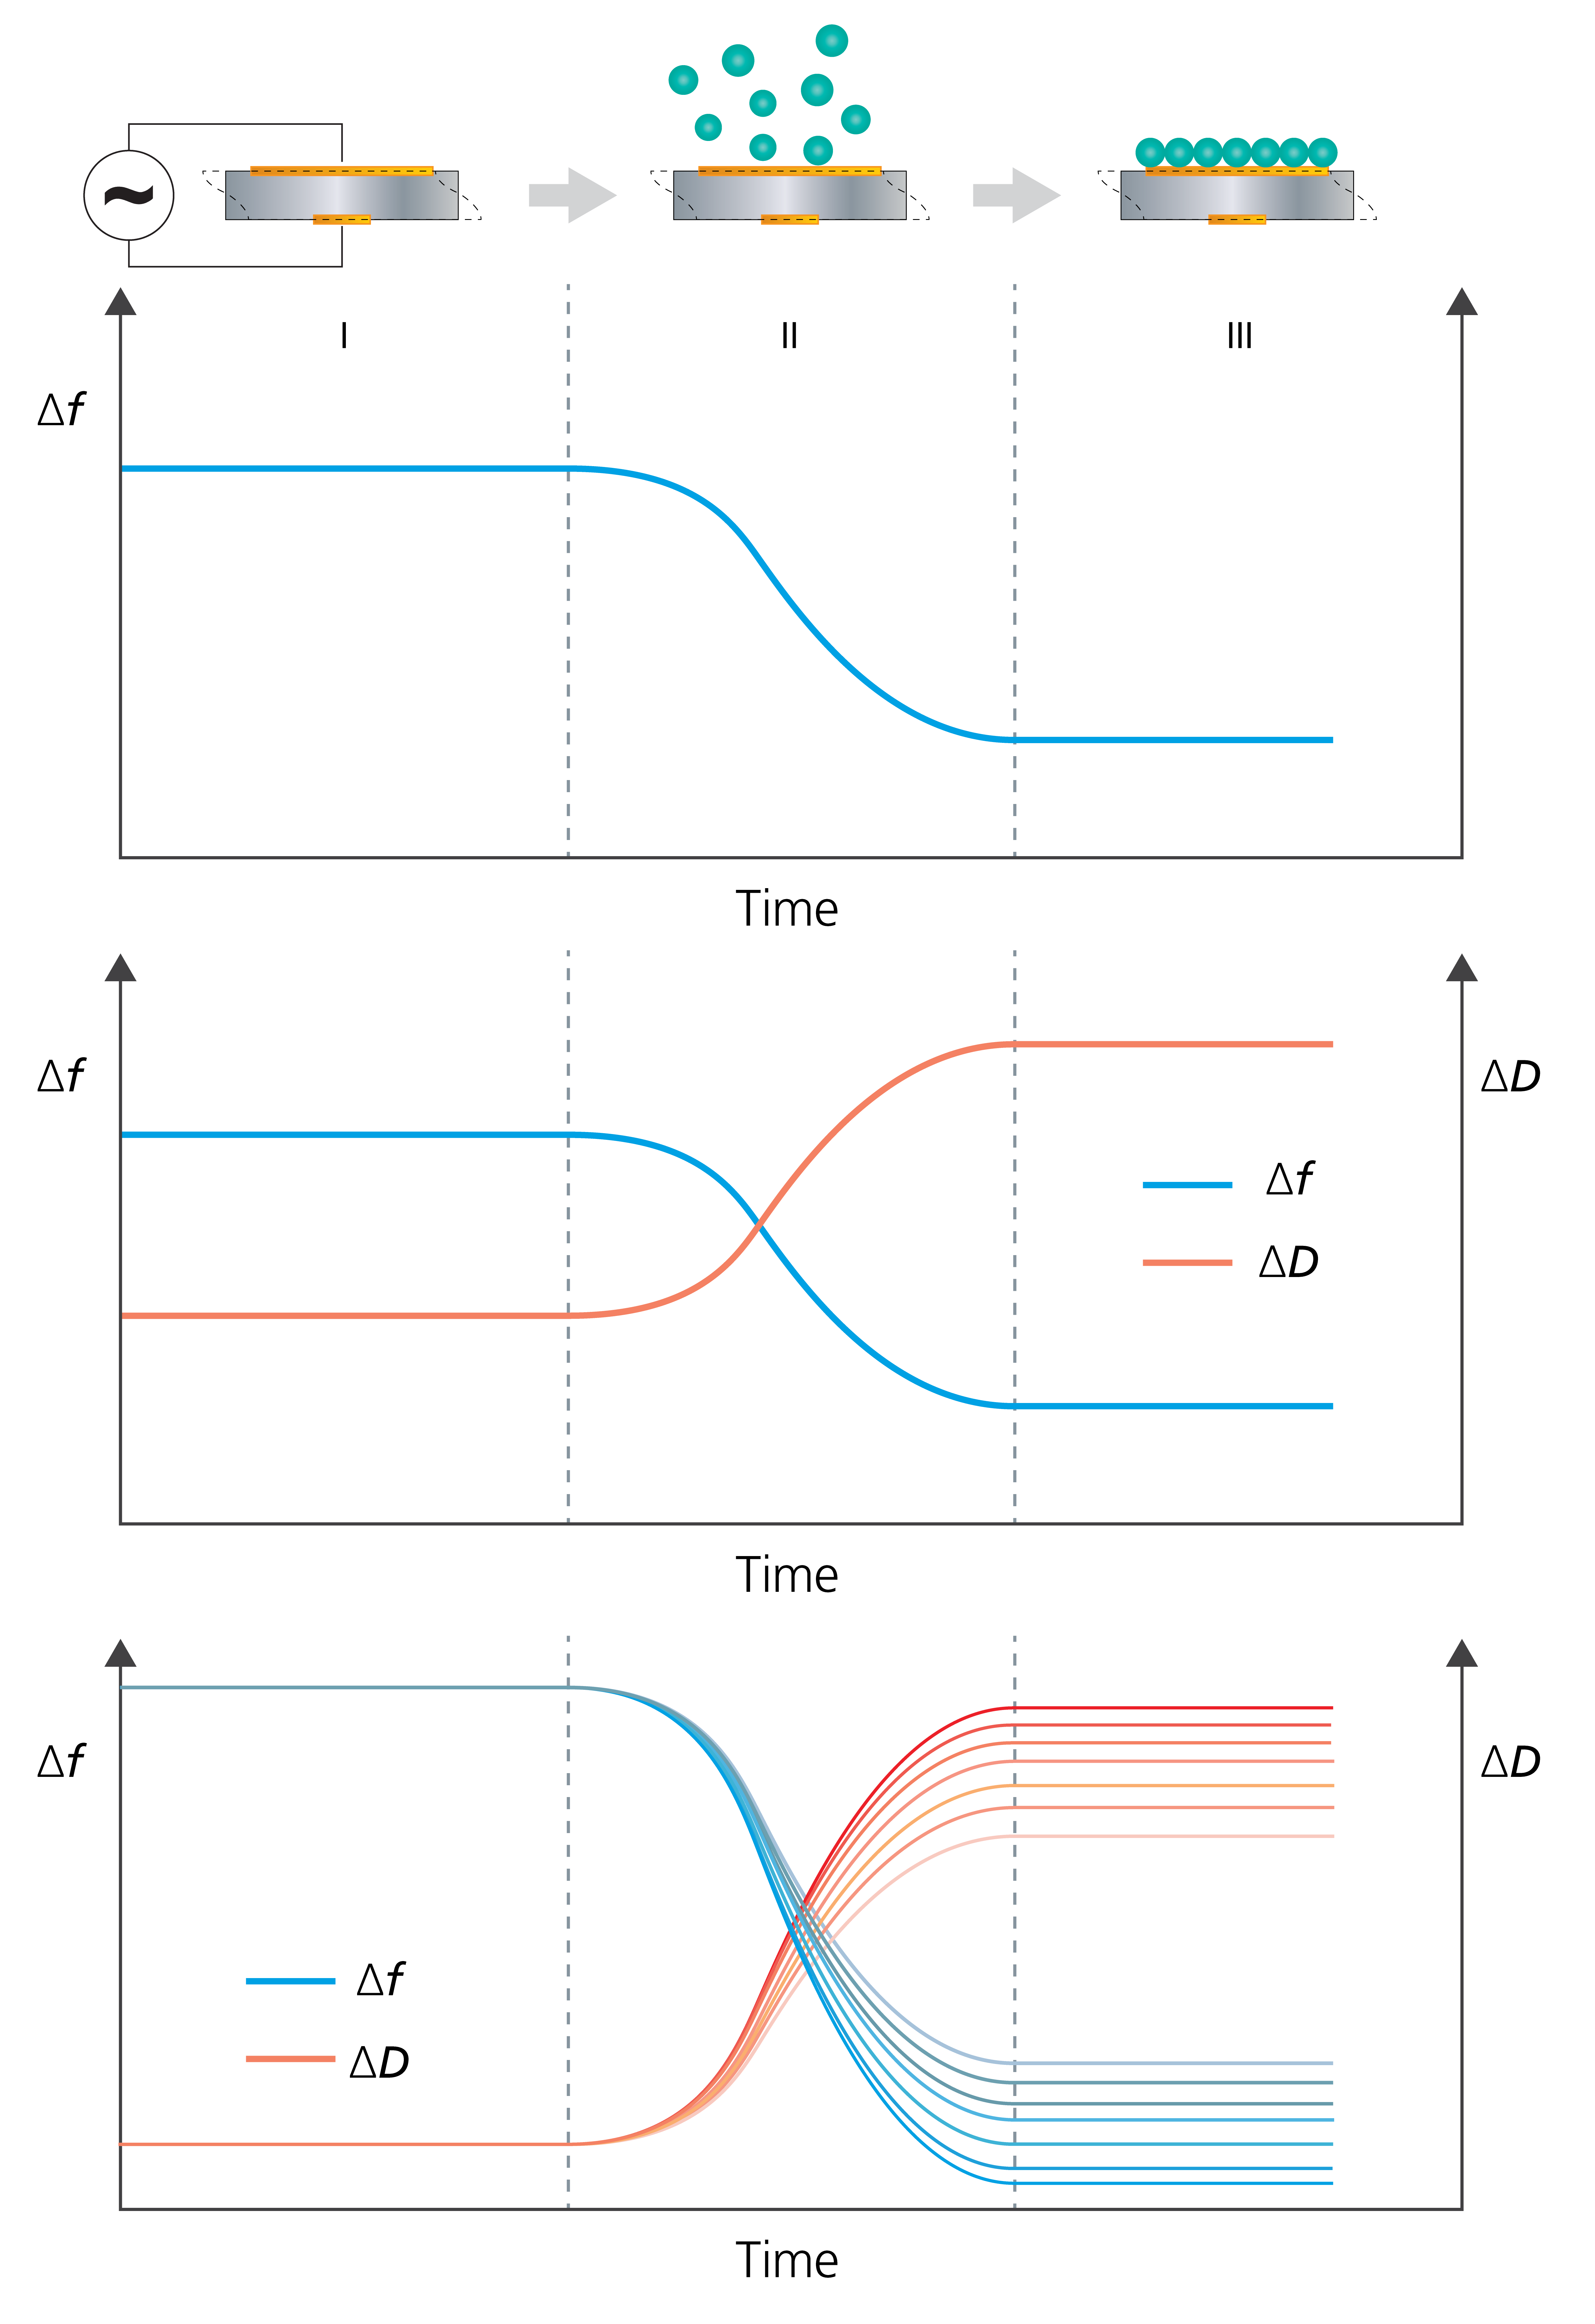
Let’s take an imaginary scenario of molecules adsorbing to the sensor surface. In terms of information output, it is interesting to compare measurements captured by the three different QCM versions single-harmonic QCM, single-harmonic QCM-D, and multi-harmonic QCM-D. Figure 1 shows schematic illustrations of what measurements of molecule adsorption could look like when measured by these three different instruments.
A. Single-harmonic QCM collects time-resolved information on the changes of one single frequency, Δf. The schematic measurement of an adsorption scenario in Fig 1 (top) showsB. Single harmonic QCM-D provides time-resolved information on f and D from one frequenct, typically the fundamental mode. The schematic measurement of an adsorption scenario in Fig 1 (middle) shows
C. Multi-harmonic QCM-D provides time-resolved information on f and D at multiple harmonics. The schematic measurement of an adsorption scenario in Fig 1 (bottom) shows

Figure 1. Schematic illustration of molecules adsorbing to the sensor surface, characterized by single-harmonic QCM (top), single-harmonic QCM-D (middle), and multi-harmonic QCM-D (bottom).
As the information collection between single-harmonic and multi-harmonic instruments differs, so does the information output. Single-harmonic QCM can be used to quantify mass, or thickness, in situations where the Sauerbrey equation is valid. Single-harmonic QCM-D, which also collects information on the energy losses of the system, can reveal whether the film is rigid or not, and if the Sauerbrey equation can be used for the quantification of mass. If f and D are collected at multiple harmonics, it is also possible to quantify mass, thickness, and viscoelastic properties of soft layers at the sensor surface.
To conclude, the wide array of QCM instruments available in the market, ranging from standard QCM:s to extended versions like QCM-D, offer varying capabilities for monitoring changes in mass or thickness of layers at the sensor surface. Single-harmonic QCMs excite the crystal at a single frequency, while multi-harmonic QCMs utilize multiple frequencies, providing different types of information output. Understanding the differences between single-harmonic and multi-harmonic QCM:s can help in selecting the most suitable instrument based on your specific measurement needs, whether it involves obtaining a qualitative indication of molecule-surface interaction or quantifying mass or analyzing viscoelastic properties of layers.
Download the overview to learn more about the working principles of QCM and QCM-D and the difference between them.
Editors note: this post was originally published in May 2020 and has been updated
Learn how QSense QCM D can be used to analyze swelling of thin films, including magnitude and dynamics.
Read about how molecule-surface interaction processes such as adsorption and desorption can be analyzed with QCM-D.
Learn best practices and step-by-step methods for accurate QCM-D coating thickness measurement on QSense sensors using QSense Omni.
Compared to QCM, QCM-D measures an additional parameter, and provides more information about the system under study.
Discover how QCM-D analysis reveals real-time etching dynamics, helping optimize cleaning processes and protect surfaces from unwanted damage.
Discover how QSense QCM-D helps tackle fouling challenges across industries
Discover how QCM-D enables real-time, label-free analysis of supported lipid membrane formation, structure, and dynamics for advanced research
Learn how QSense QCM-D analysis can reveal membrane fouling dynamics and optimize cleaning strategies for more efficient water treatment
Learn how QSense QCM-D helps detect and prevent surface-induced instabilities in biologics. Join our webinar for insights and practical examples.
