QSense QCM-D can be used to measure thin film degradation in real time by tracking changes in resonance frequency, Δf, and dissipation, ΔD, as material is removed from a surface or as a surface‑bound layer breaks up, dissolves, corrodes, is etched, or is removed during cleaning. As degradation and removal proceed, QCM-D records mass loss from the surface together with changes in the viscoelastic properties of the remaining layer, making it possible to follow both the extent and the dynamics of the process.
By combining the QCM-D signals with appropriate modeling, it is also possible to quantify changes in thickness and evaluate how rapidly a layer swells, breaks up, compacts, or is removed under different conditions.
Thin film degradation is a common interfacial process in both natural and engineered systems. In some situations, degradation is undesirable, for example when coatings corrode, protective films fail, or material is etched away unintentionally. In other cases, degradation is exactly what is needed, such as when a deposit must be removed during cleaning, when a sacrificial layer is dissolved, or when a surface is intentionally etched in manufacturing.
What these cases have in common is that material is lost from the interface over time. Sometimes the material being removed is a film on top of the surface, such as a foulant, stain, or coating. In other cases, the surface itself is being degraded, for example during corrosion or etching. In both situations, it can be of interest to understand how fast the process occurs, how much material is removed, and whether the process involves simple mass loss or a more complex pathway that includes swelling, breakup, softening, or restructuring before removal.
Such degradation and removal processes are relevant in several important contexts, including cleaning of deposited soils, etching of thin surface layers, and fouling and cleaning in systems such as water filtration. Because these are interfacial phenomena involving changes in both mass and mechanical properties, they are well suited for study with QSense QCM-D, a surface-sensitive and label-free technique that makes degradation processes visible in real time.
QSense QCM-D records two primary signals:
Frequency shift, Δf: The frequency shift reflects changes in the mass coupled to the sensor surface. When material is removed from the surface, the apparent mass decreases and the frequency typically increases.
Dissipation shift, ΔD: The dissipation shift reflects the viscoelastic properties of the layer at the surface, i.e. how rigid or soft the layer is. Changes in dissipation can reveal whether the degrading layer becomes softer, more hydrated, or more compact before or during removal.
Together, these signals provide time-resolved information about:
In many systems, degradation is not simply a direct loss of mass. A film may first absorb solvent, swell, loosen, or reorganize before fragments detach or dissolve. QCM-D is particularly useful in these cases because it can detect both the mass change and the evolution of the mechanical properties of the layer.
Thin film degradation can take several forms depending on the system. In some cases, a deposited layer breaks up and is removed from the underlying surface, as in cleaning or dissolution of a fouling layer. In other cases, the material being degraded is the surface itself, as in corrosion or etching. This broader perspective is useful because the underlying question is often the same: what happens at the interface as material is destabilized and removed?
Examples include:
In all of these cases, QCM-D can help map the removal process and distinguish between intermediate steps such as swelling, softening, compaction, breakup, and final desorption.
As an example, consider degradation of a thin soil layer during cleaning, Fig. 1. A fatty deposit is first formed on the surface, and a surfactant solution is then introduced to remove it. The QCM-D measurement reveals not only how much material is removed, but also how the layer changes before it detaches.
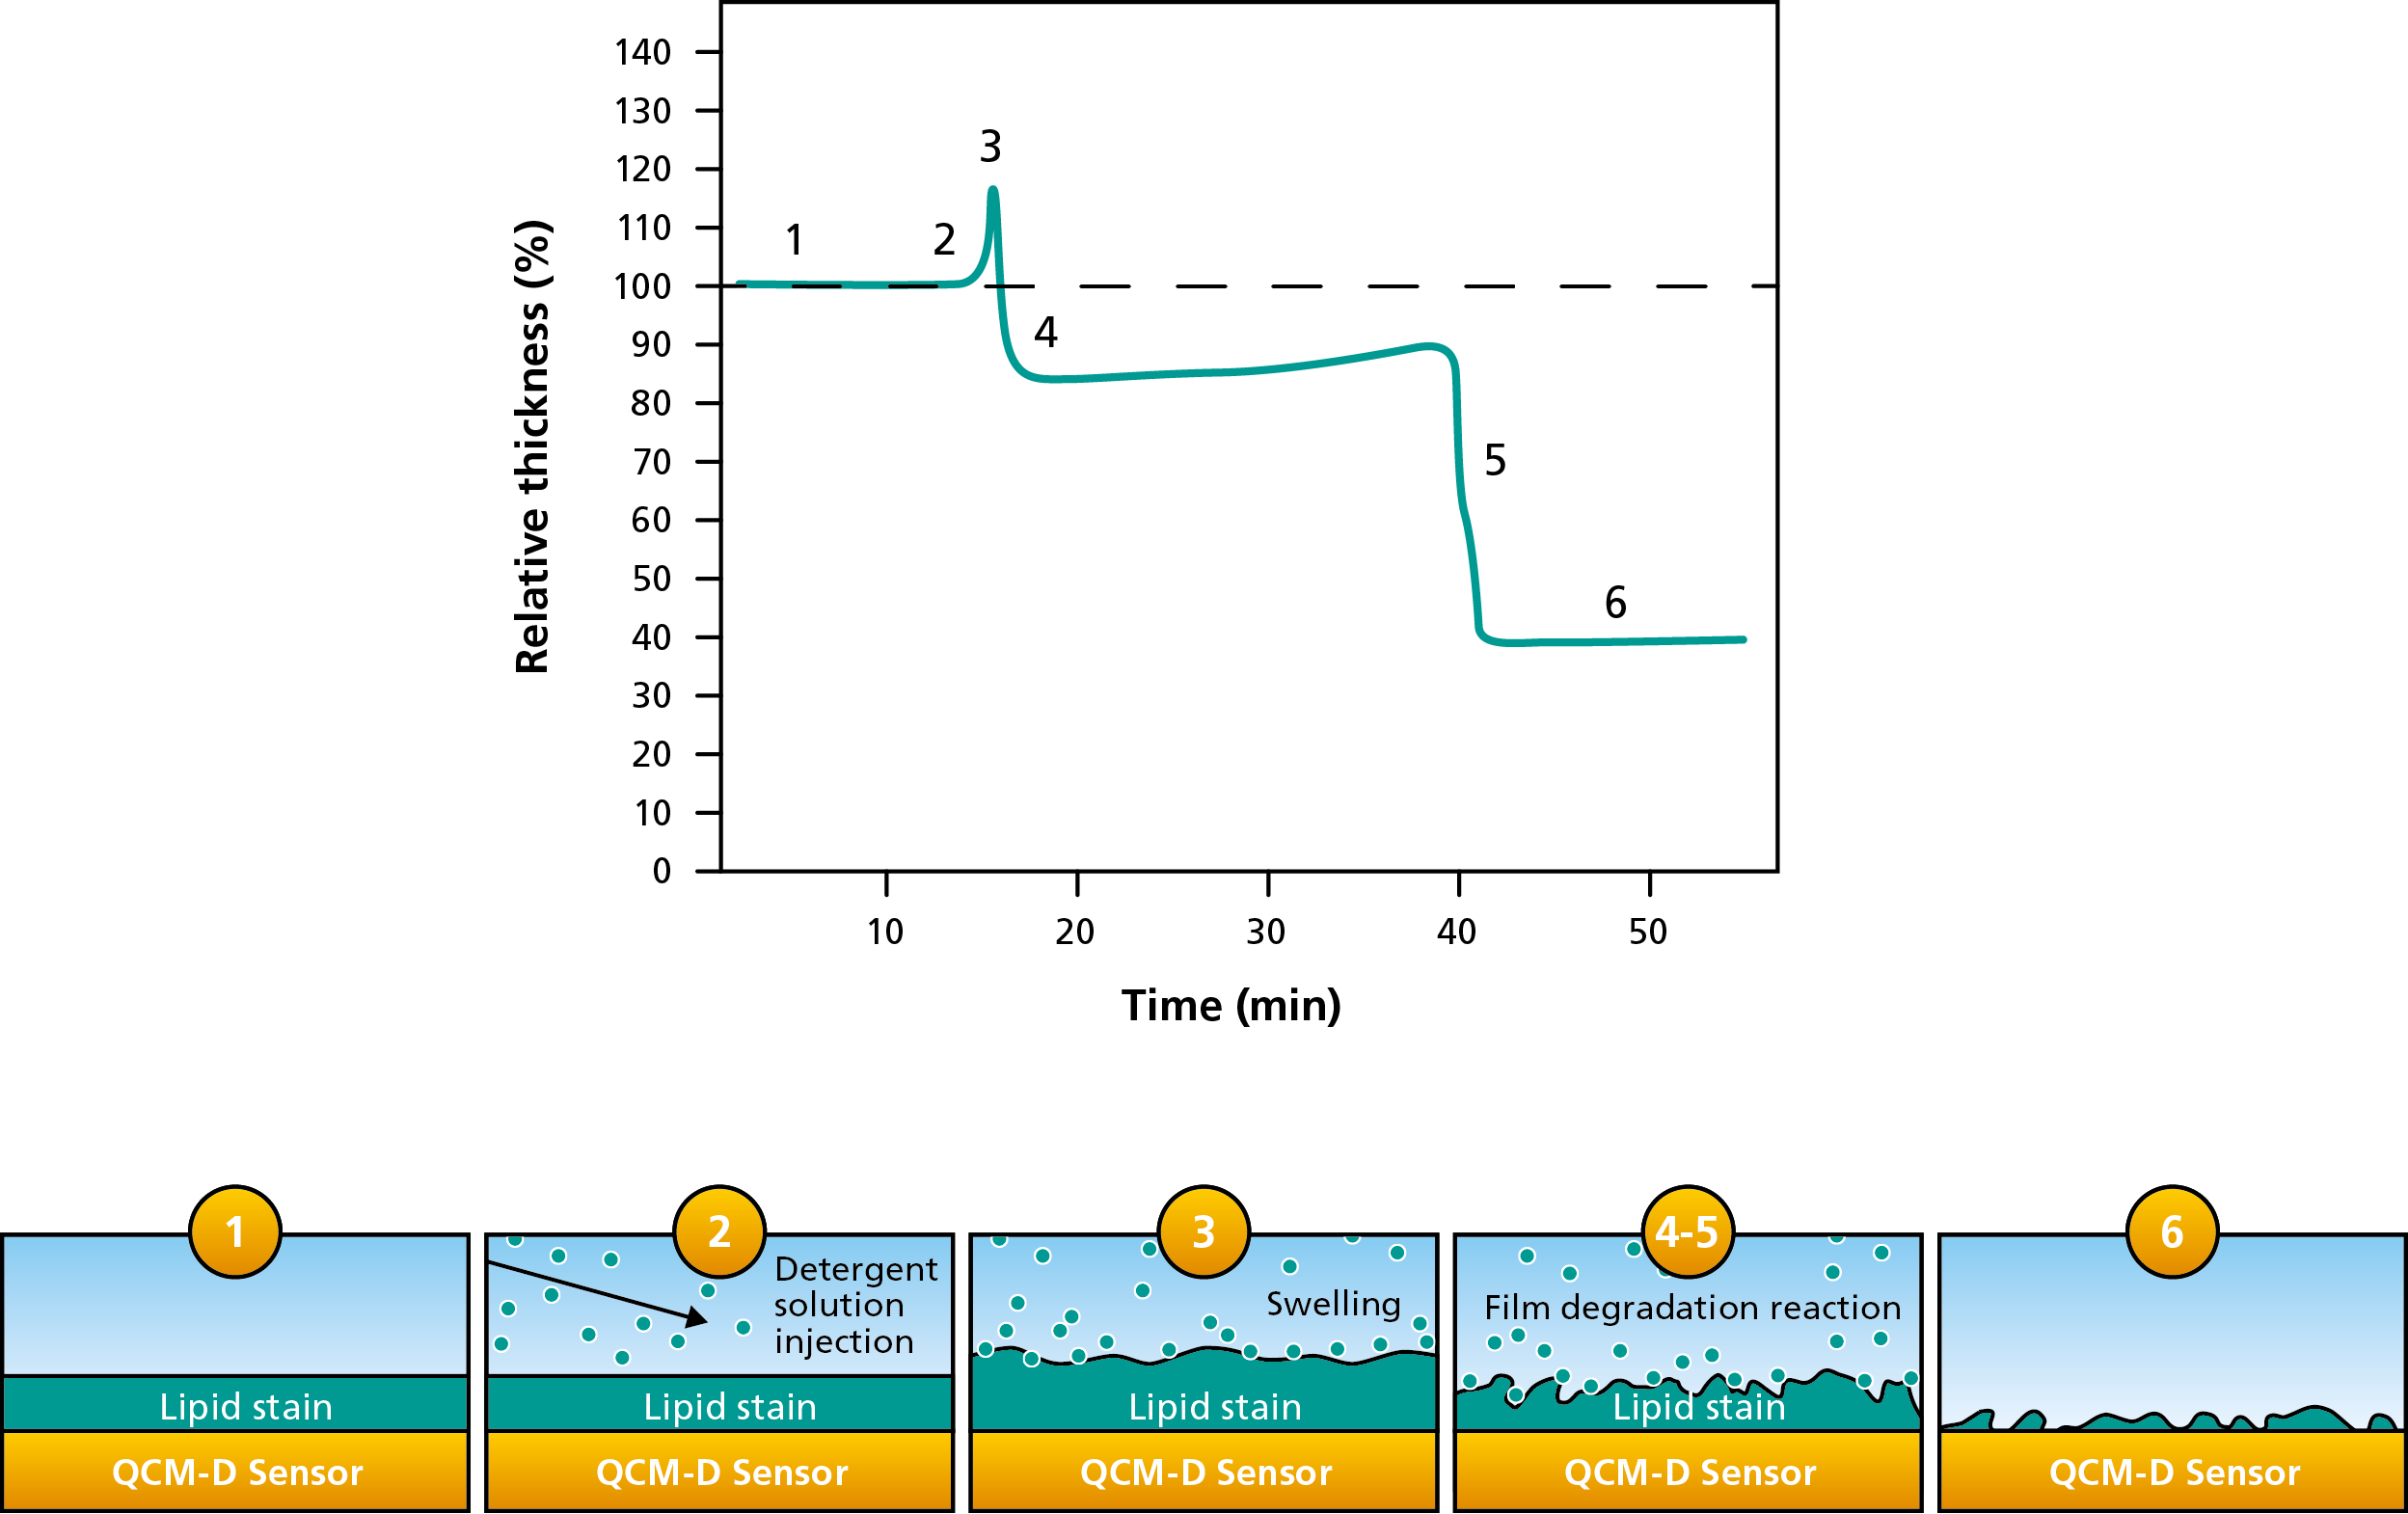
Figure 1. Monitoring a cleaning process with QCM-D technology. A deposited soil layer first swells upon exposure to detergent, then breaks up and is progressively removed during cleaning and rinsing.
The cleaning process can be followed in several steps:
1. Start with a deposited soil layer: A thin layer of fat is deposited on the sensor surface to represent the soil to be removed. Water is used as the background solution. Under these conditions, little or no mass is removed, showing that the soil does not dissolve significantly in water alone.
2. Introduce the detergent solution: A detergent or surfactant solution is then flowed over the fatty film. The detergent begins to interact with the deposited layer.
3. Swelling and softening of the soil layer: As the detergent penetrates the soil, the layer may initially swell. In QCM-D, this can appear as an increase in apparent thickness and often a dissipation response consistent with a softer, more hydrated layer.
4. Breakup and degradation of the film: As cleaning proceeds, the soil layer begins to break up and detach from the surface. QCM-D records this as a decrease in coupled mass and a corresponding reduction in thickness.
5. Rinse and continued removal: A final rinse step with water can remove additional loosely bound or partially detached material. This often leads to further mass loss from the surface.
6. Evaluate the remaining material: At the end of the experiment, the total amount removed can be quantified. In this example, 60% of the initial material is removed from the surface.
This type of measurement shows that cleaning is not always a single-step removal event. Instead, the deposited film may first absorb surfactant, swell, weaken, and then break up before being carried away. QCM-D makes these stages visible and measurable in real time.
The exact QCM-D response depends on the degradation mechanism, but some typical patterns are common.
During swelling or penetration of the degrading layer: If a solution penetrates into the film before removal, QCM-D may show:
During breakup, dissolution, or removal: As material leaves the surface, QCM-D typically shows:
During corrosion or etching of the surface itself: If the surface or coating is being consumed directly, the response may primarily reflect progressive mass loss, sometimes with additional dissipation changes depending on whether roughness, porosity, or intermediate surface structures develop. This makes QCM-D useful for following etching kinetics in real time and for comparing how different process conditions influence degradation and material removal at the surface.
A generic protocol for studying thin film degradation with QCM-D can be adapted to many systems, including cleaning, etching, corrosion, and dissolution.
1. Prepare the film or surface of interest: Deposit or form the film to be studied on the QCM-D sensor.
2. Establish a stable baseline: Equilibrate the system in the chosen background medium, such as water, buffer, or appropriate solvent. Wait until both frequency and dissipation are stable.
3. Introduce the degrading condition: Expose the surface to the condition that induces degradation, such as detergent, enzyme, changed pH, a temperature shift, or another trigger. Monitor Δf and ΔD continuously as the process begins.
4. Follow intermediate changes: Watch for signs of swelling, softening, or restructuring before removal.
5. Rinse or switch conditions: Introduce a rinse or recovery step to remove detached material or test whether the process continues under new conditions. Compare the final state with the initial state.
6. Analyze the data
Because QCM-D is time-resolved and highly sensitive to interfacial mass changes, it is useful for comparing degradation behavior under different experimental conditions, for example:
This makes it possible to optimize desired removal, such as in cleaning or etching, or to evaluate how to reduce unwanted degradation, such as in corrosion or coating failure.
Thin film degradation is relevant in many industries and research fields.
Deposited soils, fatty films, protein layers, and other residues often need to be destabilized and removed efficiently. QCM-D can reveal whether removal occurs directly or via intermediate steps such as swelling and breakup of the layer.
In many processes, from intentional etching to unwanted corrosion, thin surface layers are degraded and removed. QCM‑D can be used to monitor this surface degradation in real time and compare process conditions.
Biodegradable, dissolving, or stimulus-responsive films may be designed to erode or release material under specific conditions. QCM-D can help characterize these transitions.
In water treatment and filtration systems, fouling layers can build up on surfaces and membranes, reducing performance over time. QCM-D can help characterize how such layers form, evolve, and are degraded or removed under cleaning conditions.
Thin film degradation can be either beneficial or undesirable, depending on the application. It may involve removal of a deposited film, as in cleaning, or loss of the surface material itself, as in corrosion or etching. In many cases, the process includes intermediate steps such as swelling, softening, breakup, and desorption before the material is fully removed. QSense QCM-D provides a sensitive way to monitor these processes in real time. By following changes in frequency, Δf, and dissipation, ΔD, you can determine how much material is removed, how fast the process occurs, and how the viscoelastic properties of the interfacial layer change as degradation proceeds. This insight is valuable for understanding, optimizing, and controlling thin film degradation and removal across a wide range of applications, including cleaning, surface etching, and fouling removal in water-related systems.
Download the overview to read more about what information you can obtain with QSense QCM‑D and how it can be used to study thin film degradation, film formation, and other iterfacial phenomena.

Malin graduated in engineering physics in 2006, where her research focused on the QCM-D technology. Since then, she has been scrutinizing the how’s and why’s of the world in general, and the world of QCM-D in particular.

