One of the major challenges in pharmaceutical development is protein aggregation – a phenomenon that could have negative impact not only on the drug quality, but which could also potentially affect drug safety. In a recent study1, results are presented that provide a deeper understanding of the relation between protein adsorption and aggregation at the oil-water interface. The new insights could help designing more stable therapeutic formulations, and QSense QCM-D was one of the analysis methods that helped piecing the puzzle together.
As we talked about in a previous blogpost, a common way to store and administer therapeutic protein is via prefilled syringes - syringes where the interior surfaces typically are coated with a lubricant, silicone oil, to facilitate the use of the syringe. As the therapeutic protein stored in the syringe interacts with this hydrophobic surface it could adsorb, a process which has been a suspected source of aggregation.
To get a deeper understanding of protein interaction with silicone-oil coated surfaces, and how this is potentially related to protein aggregation, a group of researchers set out to analyze the surface activity of monoclonal antibodies (mAbs)1, a major class of protein-based therapeutics used for the treatment of several different diseases. In the study1, the researchers also analyzed if two, pharmaceutically relevant, and commonly used, surfactants would lower the adsorption and aggregation of the mAbs under investigation.
To paint the full picture, and to get a deeper understanding of the surface activity and the aggregation of the mAbs, several complementary analysis methods were used1. The surface mass adsorption of the two mAbs, the two surfactants and mAb + surfactant mixtures was analyzed by QCM-D, a surface sensitive technology that detects time-resolved mass changes at the nanoscale.
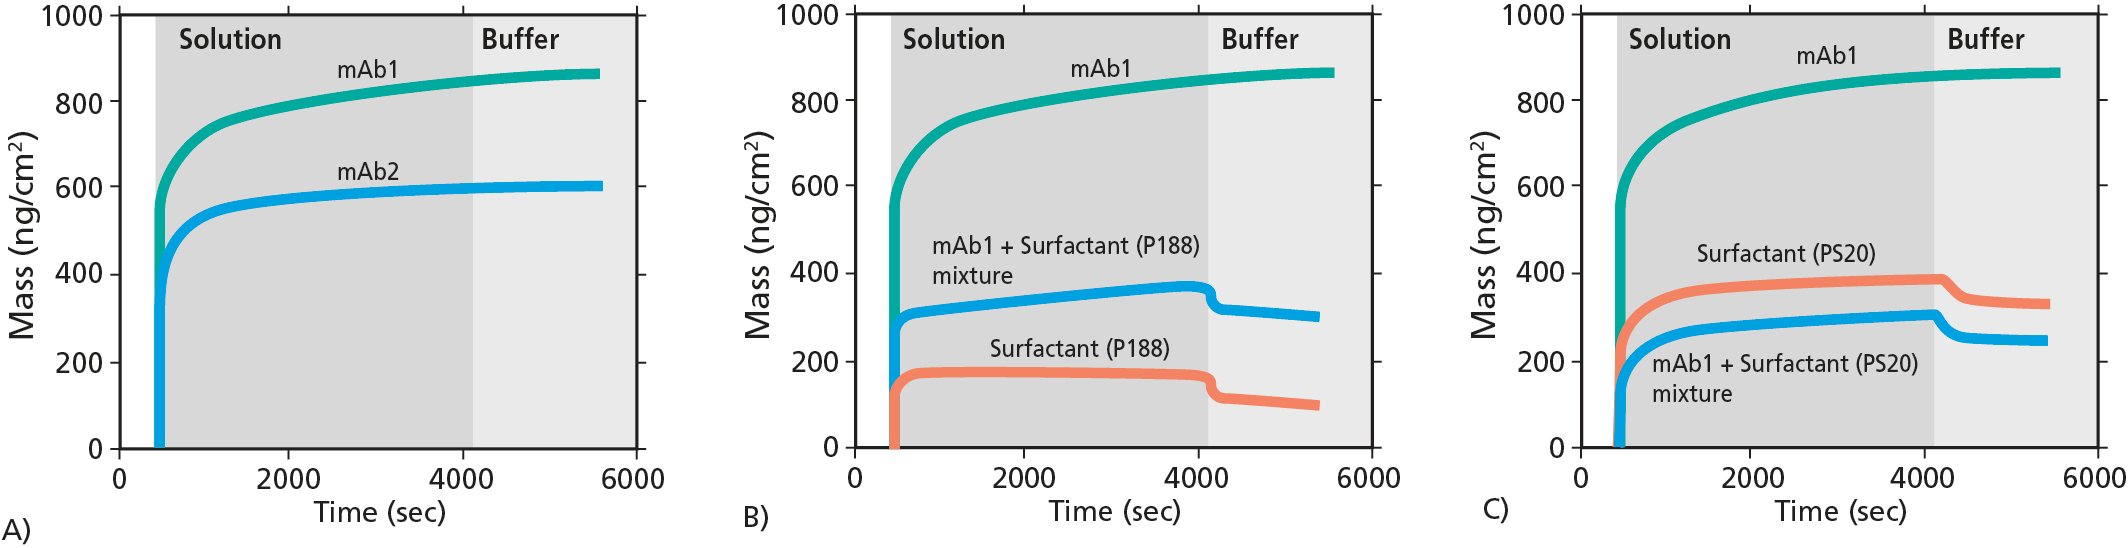
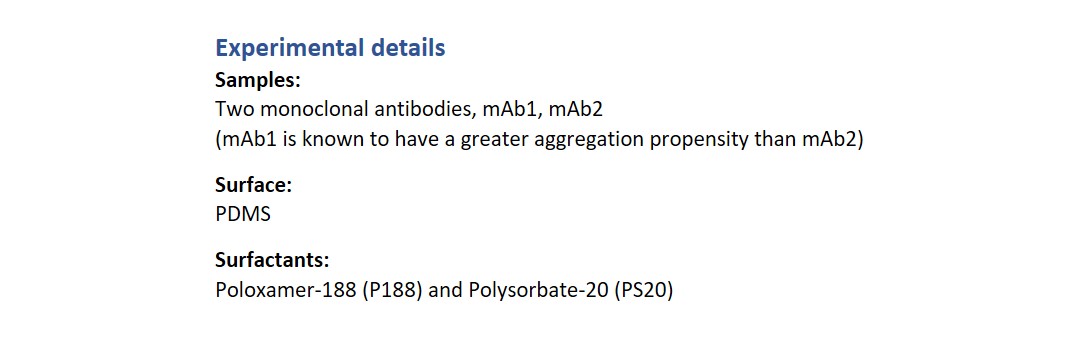
Figure 1. Mass uptake at the sensor surface measured by QCM-D. A) Comparison of mass uptake of mAb1 and mAb2. B) and C) comparison of mAb1, surfactants P188 and PS20, and mAb1 + surfactant mixtures.
The QCM-D analysis revealed several insights on the interfacial adsorption and the surface mass uptake of the mAbs, the surfactants and the mAb + surfactant mixtures1. For example, the QCM-D data, Fig 1., showed that
Combining the insights from the QCM-D analysis with information from the complementary characterization, the researchers concluded that there is a direct relation between mAbs adsorption at the oil-water interface and aggregation. The study also showed that surfactants, which will competitively adsorb to the interface, will lower the aggregation of the mAbs
Protein aggregation is one of the challenges encountered in pharmaceutical development. In a recent study1, results are presented that links absorption and aggregation, information that can help formulate more stable therapeutic solutions. In the study, the researchers used QSense QCM-D analysis to characterize the surface mass uptake - information which helped piecing the puzzle together.
Watch the webinar to learn more about this study1.

Malin graduated in engineering physics in 2006, where her research focused on the QCM-D technology. Since then, she has been scrutinizing the how’s and why’s of the world in general, and the world of QCM-D in particular.