
Quartz Crystal Microbalance with Dissipation (QCM-D) is a powerful technique for analyzing thin films and surface interactions. The QSense QCM-D sensor’s fundamental frequency is determined by its thickness, and any external coating applied to the sensor will alter this frequency. Accurate measurement of coating thickness, especially in the nanometer range, requires careful attention to both instrument precision and experimental protocol. This SOP outlines the best practices for ex situ measurement of external coating thickness, ensuring reproducibility and high-quality data suitable for scientific publication and industrial quality control.
Each QSense QCM-D sensor has a unique fundamental frequency, f1, which is determined by the thickness of the quartz crystal. Higher harmonics are integer multiples, n, of this fundamental frequency. Due to variations introduced during sensor manufacturing, particularly in the final polishing step, the fundamental frequency typically falls within the range of 4.9 to 5.0 MHz, which corresponds to a thickness variation of approximately ±3 µm. When measuring external coatings in the range of hundreds of nanometers, it is essential to consider this inherent sensor-to-sensor variation, Fig. 1. Therefore, accurate determination of coating thickness requires that measurements be made on the same sensor before and after coating, i.e. it is not possible to use a different sensor as a reference.
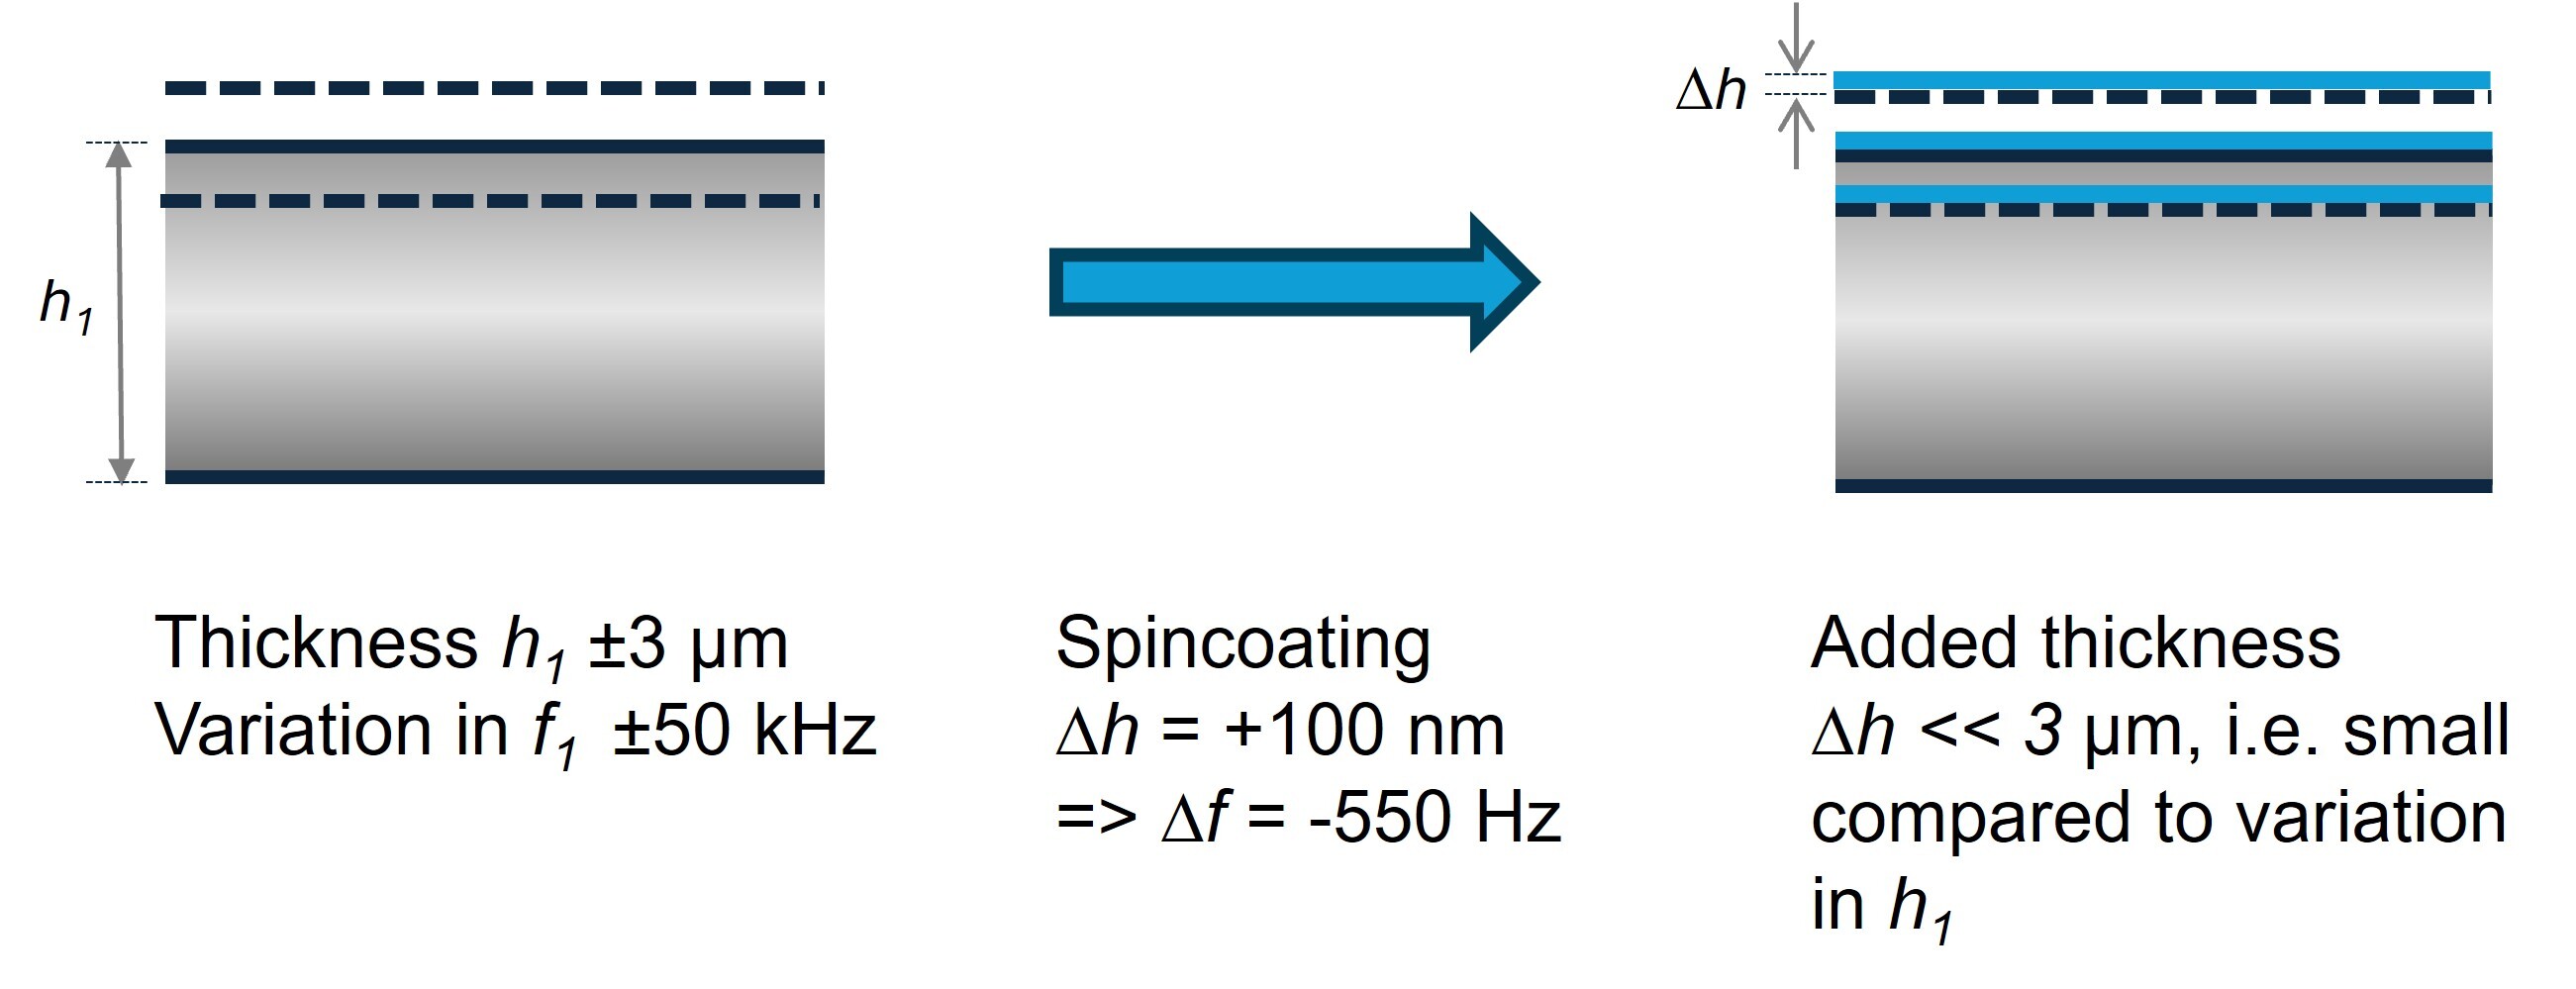
Figure 1. The sensor fundamental frequency typically ranges from 4.9 to 5.0 MHz, corresponding to a thickness variation of about ±3 µm. When measuring external coatings just hundreds of nanometers thick, it is crucial to account for this inherent sensor-to-sensor variation.
The QCM-D technique relies on precise measurement of the sensor’s resonance frequency, which is highly sensitive to the mechanical environment in which the sensor is mounted. Mechanical differences introduced during sensor mounting, such as small variations in how the sensor is seated, the pressure exerted by contact probes or o-rings, and the uniformity of the clamping force, can all influence the oscillation behavior of the quartz crystal. These subtle changes affect the boundary conditions of the sensor, potentially dampening or shifting its oscillation and resulting in small but measurable changes in the recorded frequency.
Consequently, even when no additional mass is present at the sensor surface, repeated mounting and unmounting of the same sensor can yield slightly different frequency readings. This mounting-induced variability is a critical source of error, particularly when measuring thin coatings where the expected frequency shift is relatively small. For this reason, minimizing mechanical inconsistencies during sensor installation is essential to achieve accurate and reproducible thickness measurements.
Measurement accuracy depends on minimizing errors introduced during sensor mounting. These errors can arise from:
Even under ideal conditions, there is a standard deviation in measured absolute frequency, which varies by instrument:
|
QSense Instrument |
Standard Deviation (fₙ/n) |
|
Explorer/Analyzer |
50 Hz |
|
Pro |
20 Hz |
|
Omni |
2 Hz |
Table 1. Standard deviation of absolute frequency by instrument
In addition to mechanical mounting differences, several other factors can introduce variation in frequency measurements. It is important to recognize and address these sources of error to ensure reliable results:
By systematically addressing these factors, mounting-induced variation can significantly be reduced and the accuracy and consistency of QCM-D measurements improved.
Download the full SOP for Measurement of External Coating Thickness on QSense QCM-D Sensors to access comprehensive, step-by-step instructions on how to on how to set up, execute, and analyze QCM-D coating thickness experiments using QSense Omni.


Fredrik is a Senior Application Scientist at Biolin Scientific. After his Master of Science in Biosensors- and Microsystems technology he has worked with technology and application development in as diverse fields as electroporation, multivariate gas sensing, drug screening and surface science.
