Surface etching is a frequent challenge in cleaning and processing, often resulting in unwanted material loss or surface damage. Gaining a clear understanding of how and why etching occurs is essential for optimizing cleaning protocols and protecting valuable surfaces. In this post, we demonstrate how QCM-D (Quartz Crystal Microbalance with Dissipation monitoring) analysis can reveal the real-time dynamics of etching, providing actionable insights to help control and minimize surface damage.
Undesired surface etching or corrosion can occur during cleaning, especially at high pH levels. To optimize cleaning protocols and achieve the desired degree of etching, it is important to assess how etching progresses over time and under different process conditions. QSense QCM-D offers time-resolved measurements, enabling detailed analysis of etching as a function of variables like temperature and pH.
With QCM-D data, you can extract valuable information, such as:
To showcase the capabilities of QCM-D in assessing surface etching, we conducted an experiment analyzing how a full cleaning formulation etched a soda-lime glass surface across a temperature range of 15–55 °C. We also examined the distinct slow and fast phases of etching at each temperature.
The QCM-D frequency response, which directly reflects surface mass loss, reveals how temperature affects the etching process (see Fig. 1):
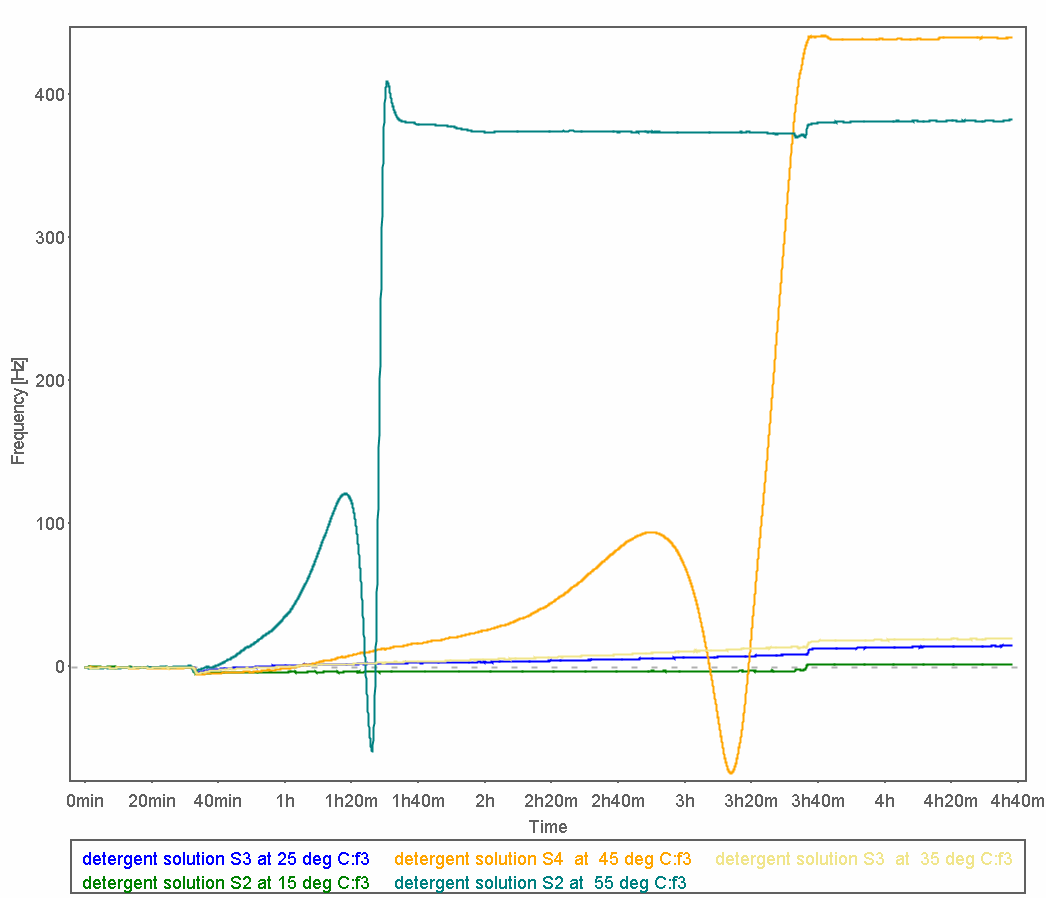
Figure 1. Etching behavior of a soda-lime glass sensor exposed to a full formulation. Frequency shifts, Δf3, at different temperatures during exposure to the market-ready formulation.
The slope of the frequency change (Δf) provides insight into the kinetics of the etching process. By analyzing how this slope varies with temperature (see Fig. 2), we can deduce reaction rates and better understand the mechanisms of material removal:
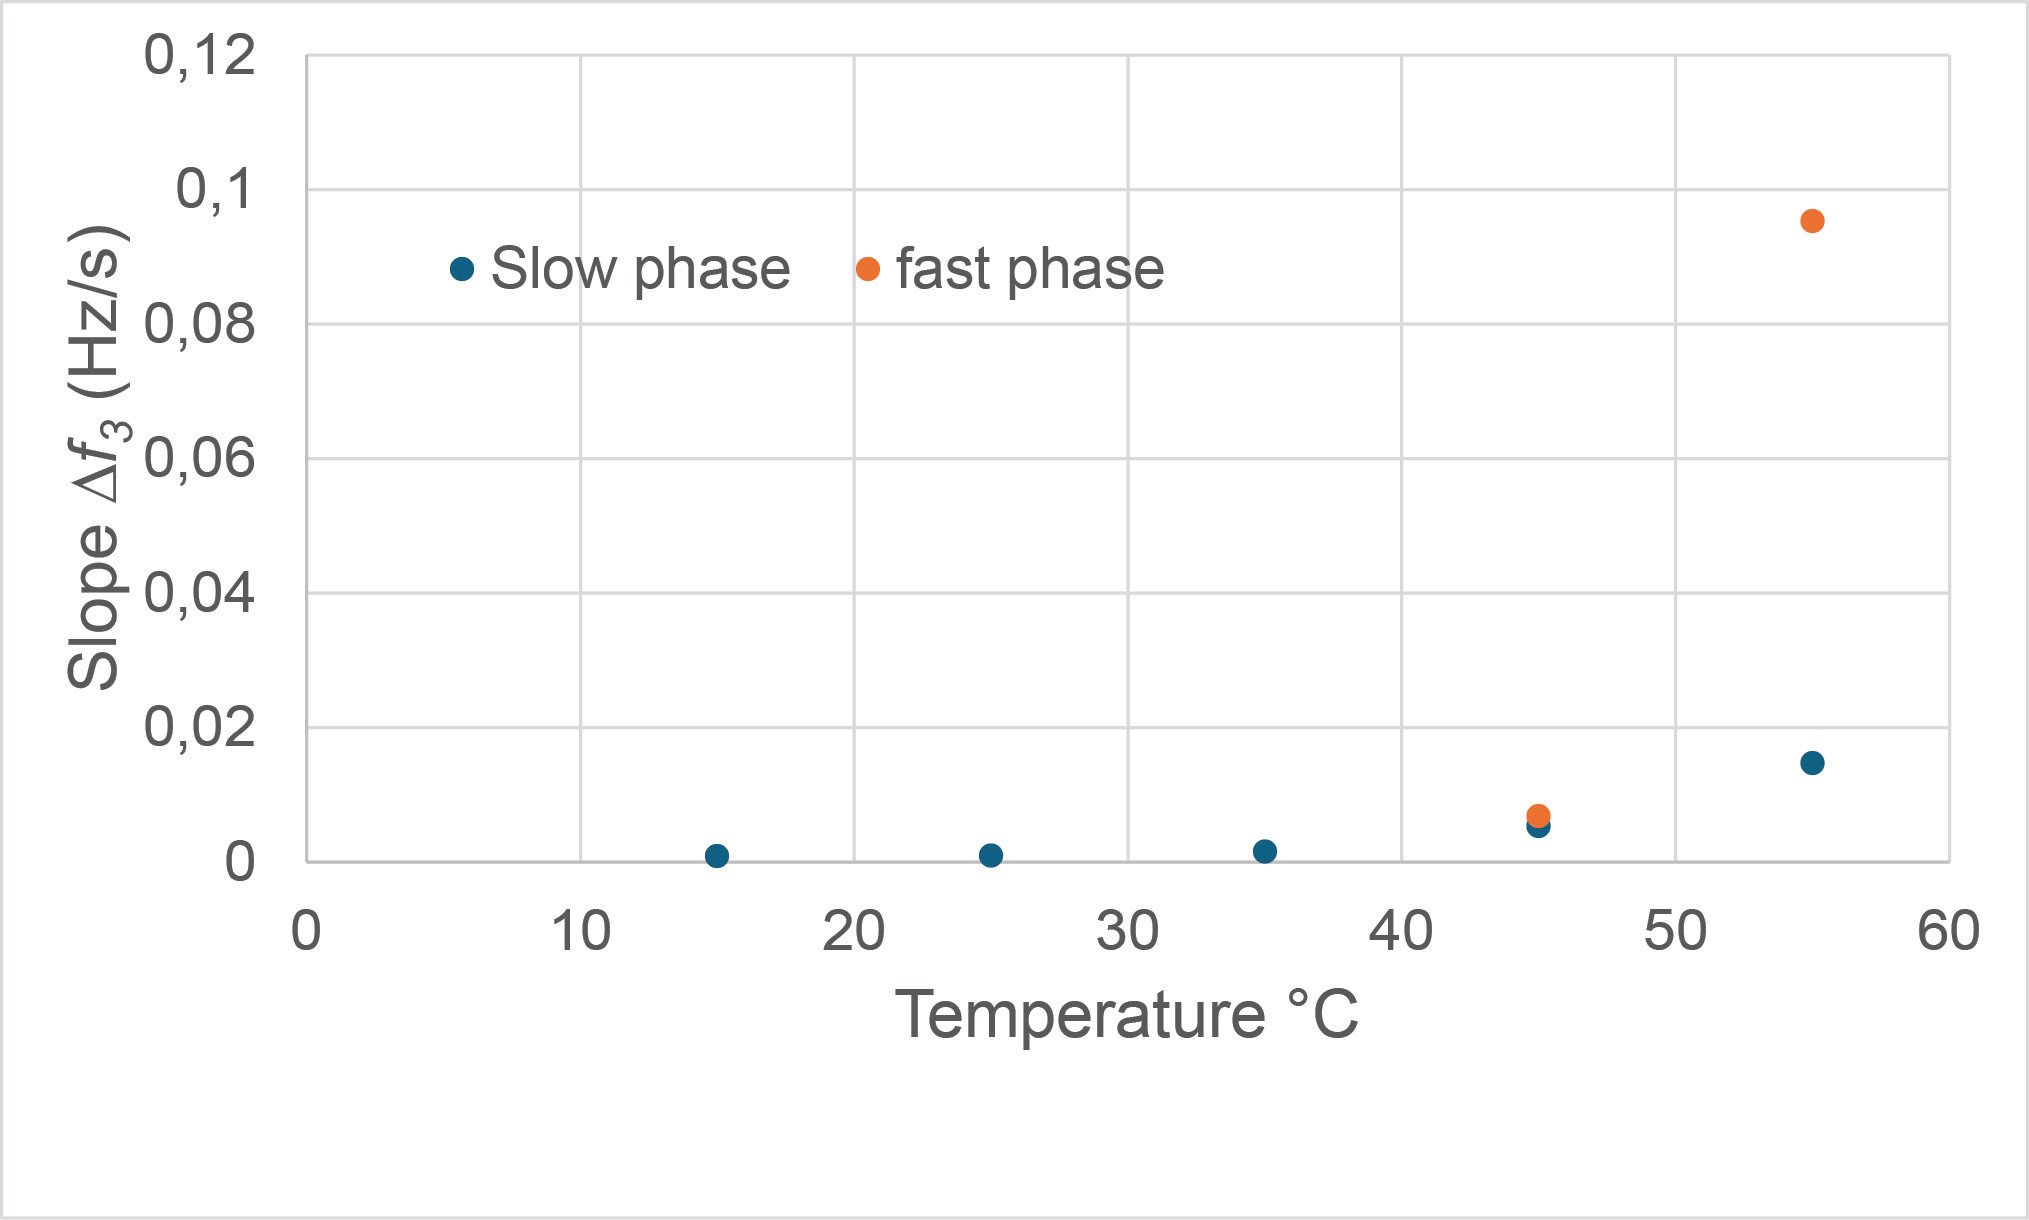
Figure 2. Etching rates in the slow and fast phases. Data collected at 15 °C, 25 °C, 35 °C, 45 °C and 55 °C.
In this post, we demonstrated how QCM-D technology can deliver valuable, time-resolved insights into the dynamics of surface etching under a variety of conditions. By analyzing the interaction between a full formulation and a soda-lime glass surface across a temperature range of 15–55 °C, we found that both the rate and nature of etching are strongly influenced by temperature. At lower temperatures, etching occurs gradually, with a slow and steady increase in frequency change. In contrast, higher temperatures accelerate the process and reveal a distinct two-phase behavior, where the second phase is notably faster. This indicates that elevated temperatures enhance chemical reactions, fundamentally altering the etching dynamics.
These findings underscore the importance of understanding etching kinetics and the role of temperature—knowledge that is essential for optimizing cleaning processes and developing effective etch protectors to minimize undesired surface damage.
Download the technical white paper to learn more about this case study and other practical applications of QCM-D in cleaning analysis.


Yousra is an Application Scientist at Biolin Scientific. She has a strong interdisciplinary research background and deep technical expertise in laboratory technologies, with a particular focus on surface science instruments. Holding a Ph.D. in Biology and Biochemistry, Yousra has extensive experience in diverse fields, including biomaterials, microbiology, and surface chemistry.

%201.png?width=160&name=yousra%20runt%20(1)%201.png)