QSense QCM‑D measures adsorption and desorption in real time by recording shifts in resonance frequency (Δf) and dissipation (ΔD) of a quartz sensor. The frequency shift reflects mass uptake or loss on the surface, and the dissipation shift reflects the mechanical (viscoelastic) properties of the adsorbed layer.
Summary
- Adsorption/Desorption: molecules adhere to a surface/leave it
- QCM‑D detects these processes as mass uptake/loss and changes in layer mechanics
- From one experiment you can get amount, rate and reversibility of binding
- You can also compare different surfaces and conditions (pH, concentration, etc.).
Introduction
Adsorption and desorption are important interfacial phenomena that often impact the performance and success of products and processes in many areas such as biotechnology, pharma, chemicals and cleaning products, as well as water and environmental technologies. In each of these areas, which molecules end up at the surface, when, in what amount, and for how long can have a major impact on whether a biomaterial becomes biocompatible or fouls, whether a biopharmaceutical remains stable, whether a cleaning product removes residues efficiently, or whether a water filter maintains its performance over time.
Because adsorption and desorption are both frequent and important at many interfaces, it can be valuable to study them to increase understanding of the system, product or process of interest. Surface and interface analysis techniques such as QSense QCM‑D, an acoustic, surface‑sensitive and label‑free technology, make these interfacial phenomena visible in real time and provide time‑resolved, quantitative data on mass uptake, mass loss and layer properties, supporting both fundamental insight and applied optimization. In simple terms, QCM-D acts as a very sensitive balance for small masses at the surface, recording how much material is added or removed and how the properties of the interfacial layer change over time.
What QSense QCM‑D measures
When you run a QCM‑D experiment, the instrument records two primary signals:
- Frequency shift (Δf) – reflects mass changes at the sensor surface: a negative shift indicates mass uptake, and a positive shift indicates mass loss.
- Dissipation shift (ΔD) – reflects the viscoelastic properties of the adsorbed layer: a higher dissipation indicates a softer, more hydrated film, while a lower dissipation indicates a more rigid, compact film.
Together, Δf and ΔD provide time‑resolved information about how much material is added to or removed from the surface, how fast this happens, and how the nature of the surface‑bound layer changes over time.
Characterizing adsorption and desorption on solid surfaces
Depending on the application and objective of your study, it may be relevant to:
- Understand or characterize how adsorption or desorption occurs on a particular surface
- Compare adsorption/desorption behavior on different materials
- Optimize adsorption or desorption conditions for a given system
In all these cases it is useful to:
- Monitor the amount of material being added to or leaving the surface (via Δf)
- Evaluate the rate at which the process occurs (dynamics from the time trace)
- Assess whether the adsorption is reversible (by comparing before/after rinse)
- Understand whether the formed layer is soft/hydrated or rigid (via ΔD)
As material is added to or removed from a surface, there is a corresponding change in mass, which will be detected by QCM‑D in real time.
Example: Evaluating protein adsorption on glass and plastic
- Parallel measurements on glass and plastic
Two measurements are run in parallel, one on glass and one on plastic. The measurements start with the respective surface in a background solution. At this point, the surfaces are bare, which means zero added mass in the QCM‑D readout (Fig. 1A).
- Adsorption: introduce the protein solution
Next, the protein solution is introduced and allowed to flow over the surface. The QCM‑D instrument captures both frequency and dissipation.
The frequency shift represents the mass change in reverse:
- A negative frequency shift (Δf < 0) means mass uptake (adsorption).
- A positive frequency shift (Δf > 0) means mass loss (desorption).
When the protein reaches the surface, there is a mass uptake on both the glass and plastic surfaces. It may be observed that the adsorption is somewhat faster on the glass surface than on the plastic one (Fig. 1B).
- Rinse: remove loosely bound protein
After 30 minutes, we rinse to remove any loosely bound protein. Here we see mass loss (Δf increases) from both the glass and plastic surfaces (Fig. 1C).
- End point: compare final adsorbed amount
At the end of the experiment, the final frequency level (after rinse) can be compared between the two surfaces. We conclude that the final adsorbed amount is larger on the glass than on the plastic surface.
- At the end of the experiment, we conclude that the final adsorbed amount was larger on the glass than on the plastic surface (Fig. 1D).
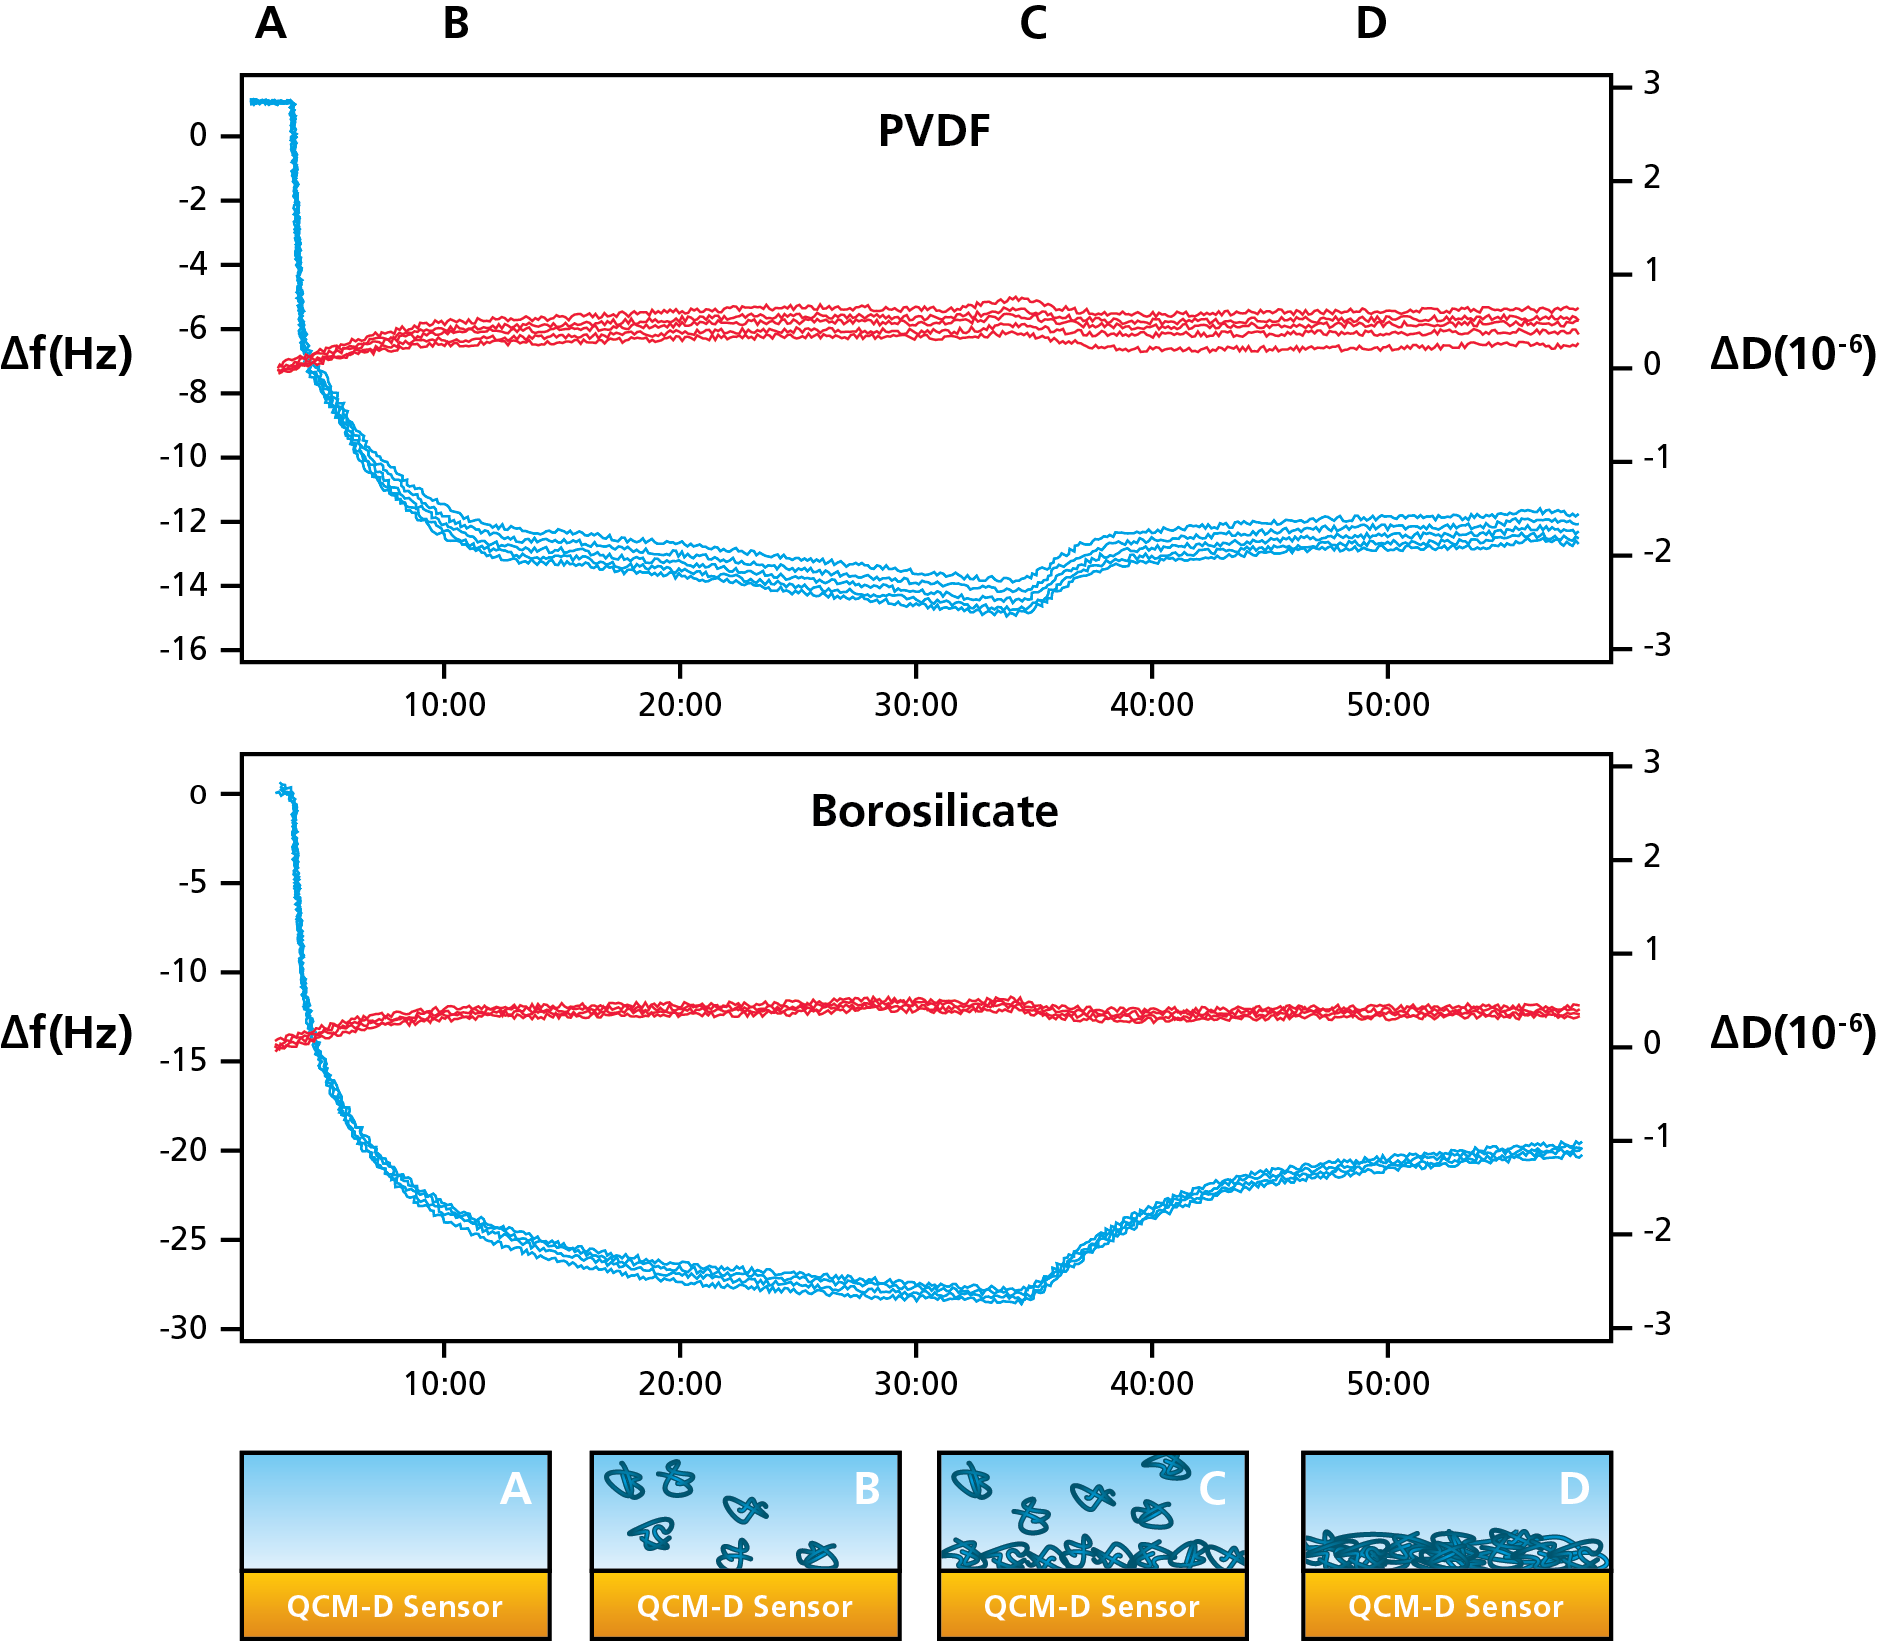
Figure 1. (Top) Protein adsorption on plastic (PVDF) and glass (borosilicate) measured with QCM-D. (Bottom) Schematic illustration of the protein adsorption process.
Practical protocol: setting up adsorption and desorption measurements
Below is a general protocol that can be adapted to your specific system.
- Sensor selection and preparation
- Choose a sensor surface that is relevant for your system (e.g., gold, silica, polymer‑coated, glass, plastic)
- Clean and handle sensors according to recommended procedures to avoid contamination (cleanliness is key)
- Baseline stabilization
- Mount the sensor in the QSense instrument and flow the background solution (buffer or solvent) over the surface
- Allow the system to equilibrate until a stable baseline is achieved for both frequency and dissipation (no drift)
- Adsorption phase
- Introduce the sample solution (e.g., protein, polymer, surfactant, nanoparticles) at a defined concentration and flow rate
- Record Δf and ΔD over time as adsorption proceeds and approaches a plateau or until your chosen contact time is reached
- Desorption / rinse phase
- Switch back to background solution or introduce an appropriate rinsing or desorbing solution
- Record the changes in Δf and ΔD as loosely bound material is removed from the surface
- Data analysis
- Inspect the time‑resolved traces to determine adsorption and desorption rates, and to compare final adsorbed amounts between surfaces or conditions.
- Use several overtones to evaluate layer uniformity and mechanical behavior
- Use the Sauerbrey equation only when the film is thin, rigid and homogeneous; for soft or hydrated films, apply a viscoelastic model.
- Reporting and documentation
- For reproducibility and to enable experiment comparison, document sensor type, surface chemistry, buffer conditions, temperature, flow rate, sample concentration and timing of injection and rinse
Interpreting the QCM‑D response
When interpreting adsorption and desorption data, a few simple guidelines are useful:
- Frequency (Δf)
- Δf↓ (more negative): mass uptake (adsorption)
- Δf↑ (less negative / more positive): mass loss (desorption)
- Dissipation (ΔD)
- Small change in ΔD: relatively rigid film
- Increase in ΔD: softer, more hydrated or more viscoelastic film
- Decrease in ΔD: more rigid, compact film
Typical combinations:
- Δf↓ with little ΔD change → mainly rigid mass uptake (Sauerbrey may be applicable).
- Δf↓ with ΔD↑ → adsorption of a soft or hydrated film (viscoelastic analysis recommended).
- Δf↑ with ΔD↓ during rinse → desorption and/or compaction of the remaining layer.
Comparing different conditions
Because QCM‑D is label‑free and time‑resolved, it is straightforward to compare adsorption and desorption behavior under different conditions, for example by varying:
- Sample concentration
- Temperature
- pH
- Ionic strength
- Flow rate
- Surface chemistry (different sensor coatings or materials)
This enables systematic studies of how environment and formulation changes affect surface interactions and layer stability.
Other systems: surfactants, polymers, nanoparticles
In addition to the protein example shown here, many other adsorption and desorption events can be characterized by measuring mass uptake and mass loss with QCM‑D, including for example:
- Surfactant adsorption and rinsing
- Polymer film build‑up and removal
- Nanoparticle adsorption and desorption
- Fouling and cleaning of surfaces
- Swelling and collapse of thin films (when combined with dissipation analysis)
In all these cases the core readout is the same: time‑resolved changes in mass and viscoelastic properties of a layer on a sensor surface.
Common pitfalls and practical tips
- Unstable baseline before starting: Always wait for a stable baseline in both Δf and ΔD before introducing the sample.
- Using Sauerbrey when it is not applicable: Only use the Sauerbrey equation for thin, rigid, homogeneous films with low dissipation. For soft or thick films, use a viscoelastic model.
- Looking at only one overtone: Examine several overtones to assess whether the film is uniform and to improve confidence in your interpretation.
- Neglecting temperature and buffer effects: Keep temperature and buffer conditions well controlled and, where possible, include reference measurements.
- Incomplete documentation: Record all experimental parameters (sensor, solution conditions, temperature, flow rate, concentration, sequence of steps) to enable reproducibility.
Summary
QSense QCM‑D provides a straightforward and sensitive way to monitor adsorption and desorption processes on solid surfaces. By following the mass (Δf) and dissipation (ΔD) in real time, you can quantify how much material adsorbs or desorbs, how fast it happens, whether it is reversible, and how the structure of the formed layer changes. This information is valuable across a wide range of research and development contexts where surfaces and interfaces play a critical role in product and process performance.
Download the overview to read more about what information you can obtain with QSense QCM-D.