QCM-D technology (Quartz Crystal Microbalance with Dissipation monitoring) has been a cornerstone in lipid bilayer analysis since 19981. This technology offers unique capabilities for studying the dynamics and properties of supported lipid membranes (SLBs), making it particularly well-suited for characterizing various aspects and applications of lipid membrane-based platforms.
Supported lipid bilayers (SLBs) are essential model systems for studying biological membranes. They are widely used in fields such as material science, bio-nanotechnology, and drug discovery because they closely mimic the structure and function of natural membranes. This makes SLBs invaluable for investigating membrane-related processes, including protein binding, cell signaling, and molecular interactions.
Among the various technologies available for studying SLBs, QCM-D stands out for its ability to provide real-time, label-free insights into the dynamics of lipid membrane formation and structure. The compatibility of SLBs with surface-based analytical techniques like QCM-D further enhances their utility in both fundamental and applied research.
QCM-D technology measures two parameters—frequency (f) and dissipation (D)—to provide time-resolved information on the mass, thickness, and viscoelastic properties of layers forming at the sensor surface. This dual measurement allows researchers to monitor, in real time, the interaction dynamics between lipid structures and the sensor, revealing both the process and the final properties of the supported membrane. As a result, QCM-D is particularly well-suited for detecting and characterizing the transition from surface-adhering vesicles to a surface-supported bilayer—offering detailed insights that are not possible with many other techniques.
QCM-D is particularly valuable because it is:

By collecting data at multiple overtones, QCM-D provides additional insights into the properties of the adsorbed layer.
There are several methods to form supported lipid bilayers, with the most common being:
Ambient conditions—such as temperature, buffer composition, and lipid type—significantly influence the dynamics and success of bilayer formation.2 QCM-D can reveal how these variables affect the process and whether a high-quality bilayer is achieved or not.
Let’s consider the vesicle rupture and fusion method, a widely used approach for forming supported lipid bilayers where phospholipid vesicles1-4 adsorb and then spontaneously rupture and fuse to form an SLB. Thanks to QCM-D sensing hydrated mass, the structural rearrangement from adsorbed vesicles to a supported lipid membrane results in a distinctive behavior and unique fingerprint which is straightforward to detect with QCM-D (Fig. 1).
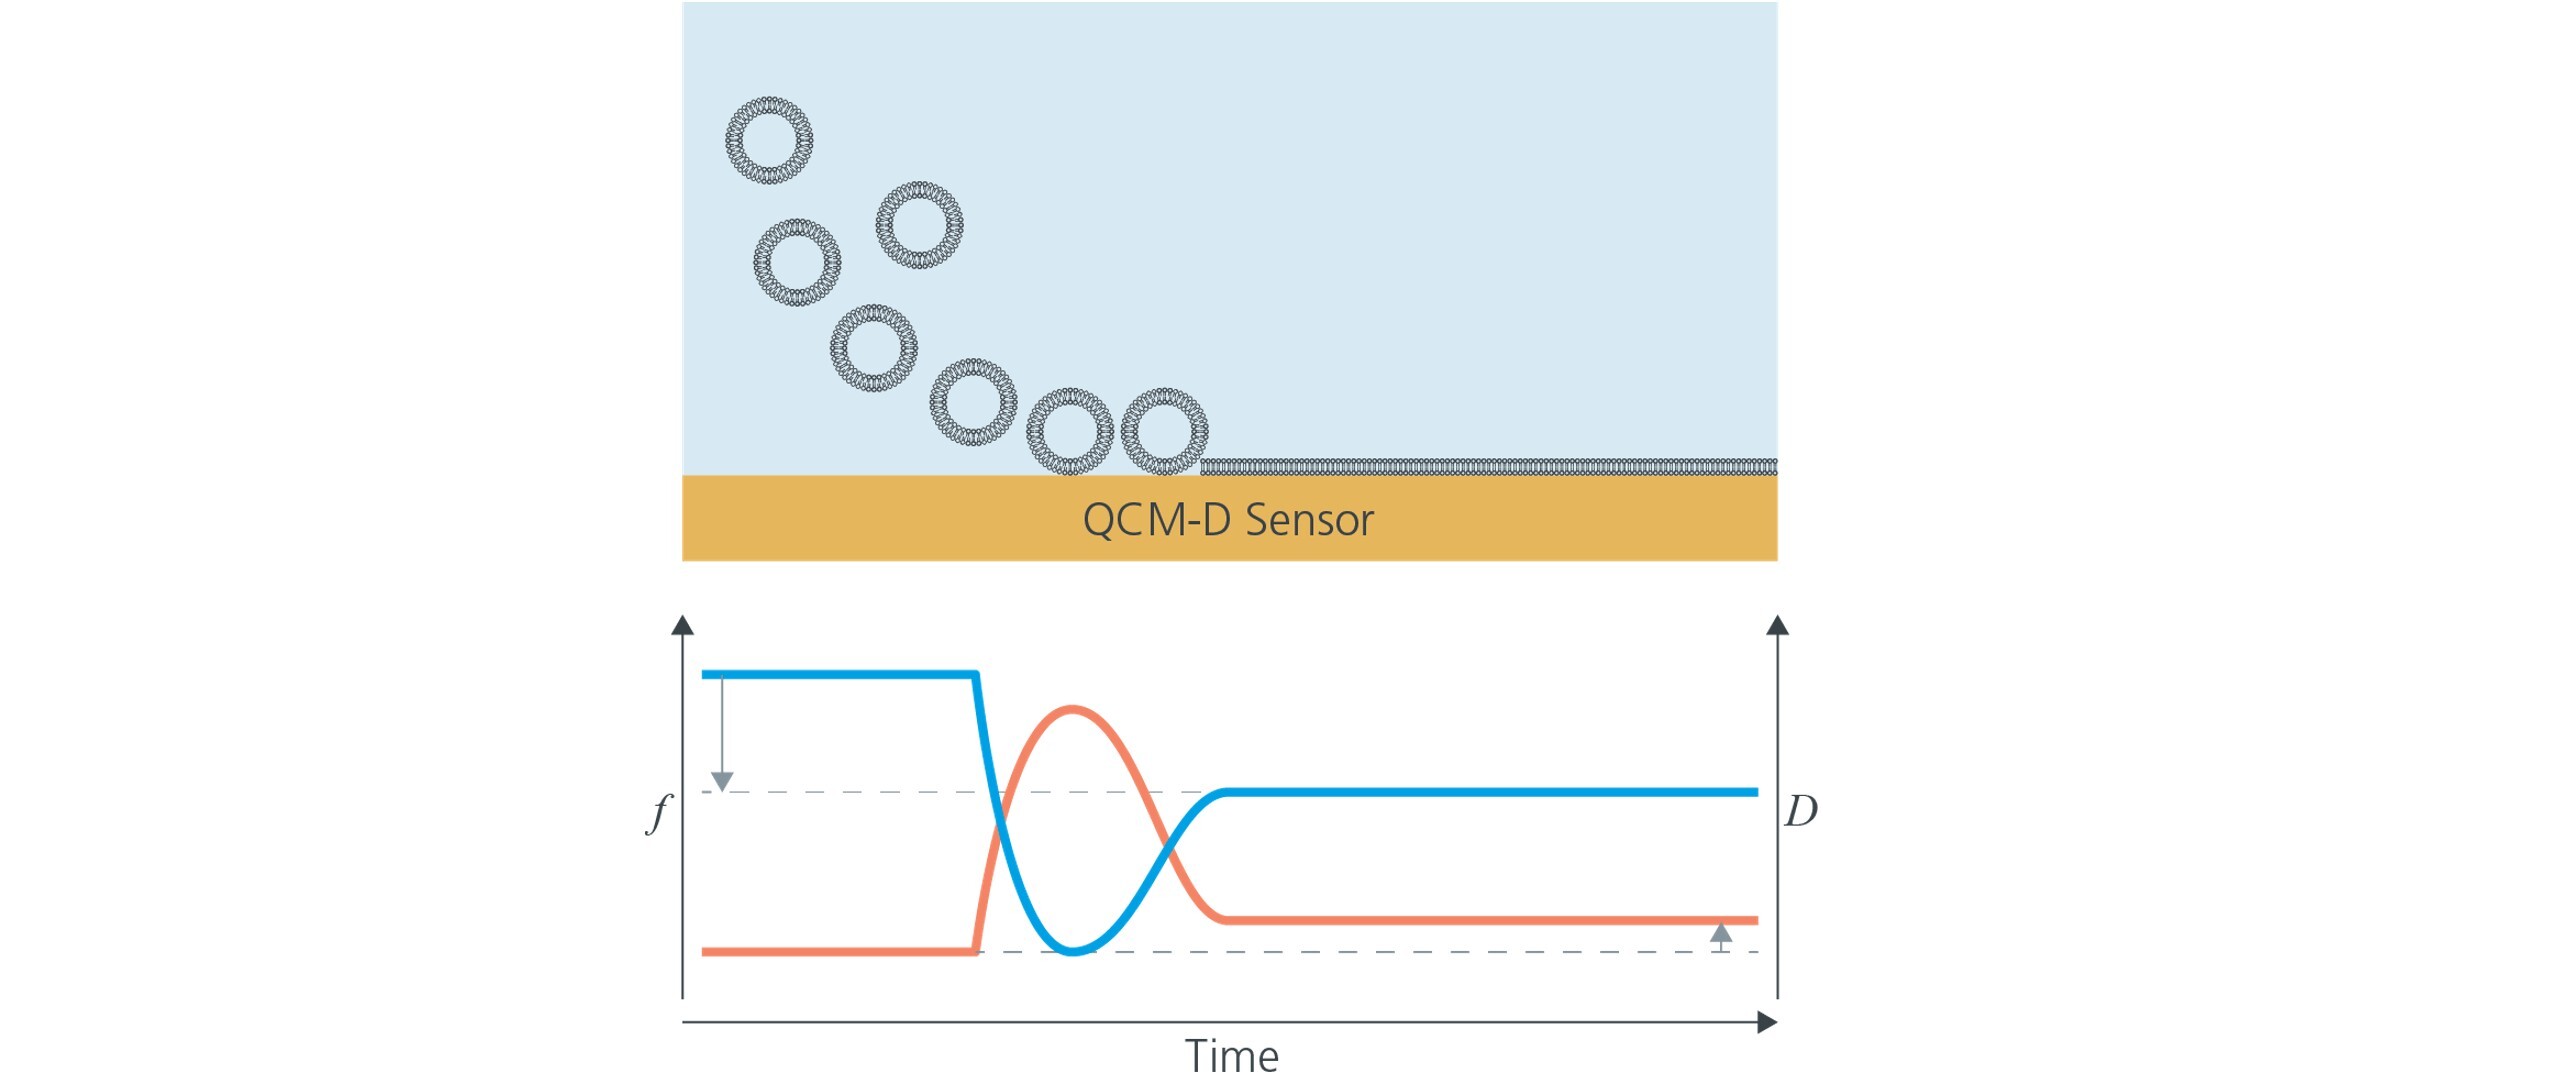
Figure 1. Formation of a supported lipid bilayer monitored by QCM-D. Starting from stable baselines in buffer, vesicles are introduced. The measured f and D show the unique fingerprint of vesicle rupture and fusion. First, there is an initial large uptake (decrease in f and increase in D) indicating vesicle adsorption at the surface. Next, both the f and D curves turn, indicating that mass is lost and the layer at the surface is becoming less soft. Finally, the curves equilibrate at characteristic f and D values, where the frequency is twice that of a lipid monolayer and the dissipation is low, indicating a thin and rigid layer.
In cases where the supported lipid bilayer is used as a model membrane platform for subsequent layer build-up, it is important to verify the bilayer formation process and evaluate the quality of the formed bilayer. It can also be relevant to explore SLB formation dynamics when complex lipid mixtures are used or when ambient conditions are changed. Here, QCM-D can help determine whether vesicles are successfully rupturing, how quickly the bilayer forms, and whether the final membrane meets the required standards for further experimentation.
Use QCM-D, for example, to (Fig. 2):
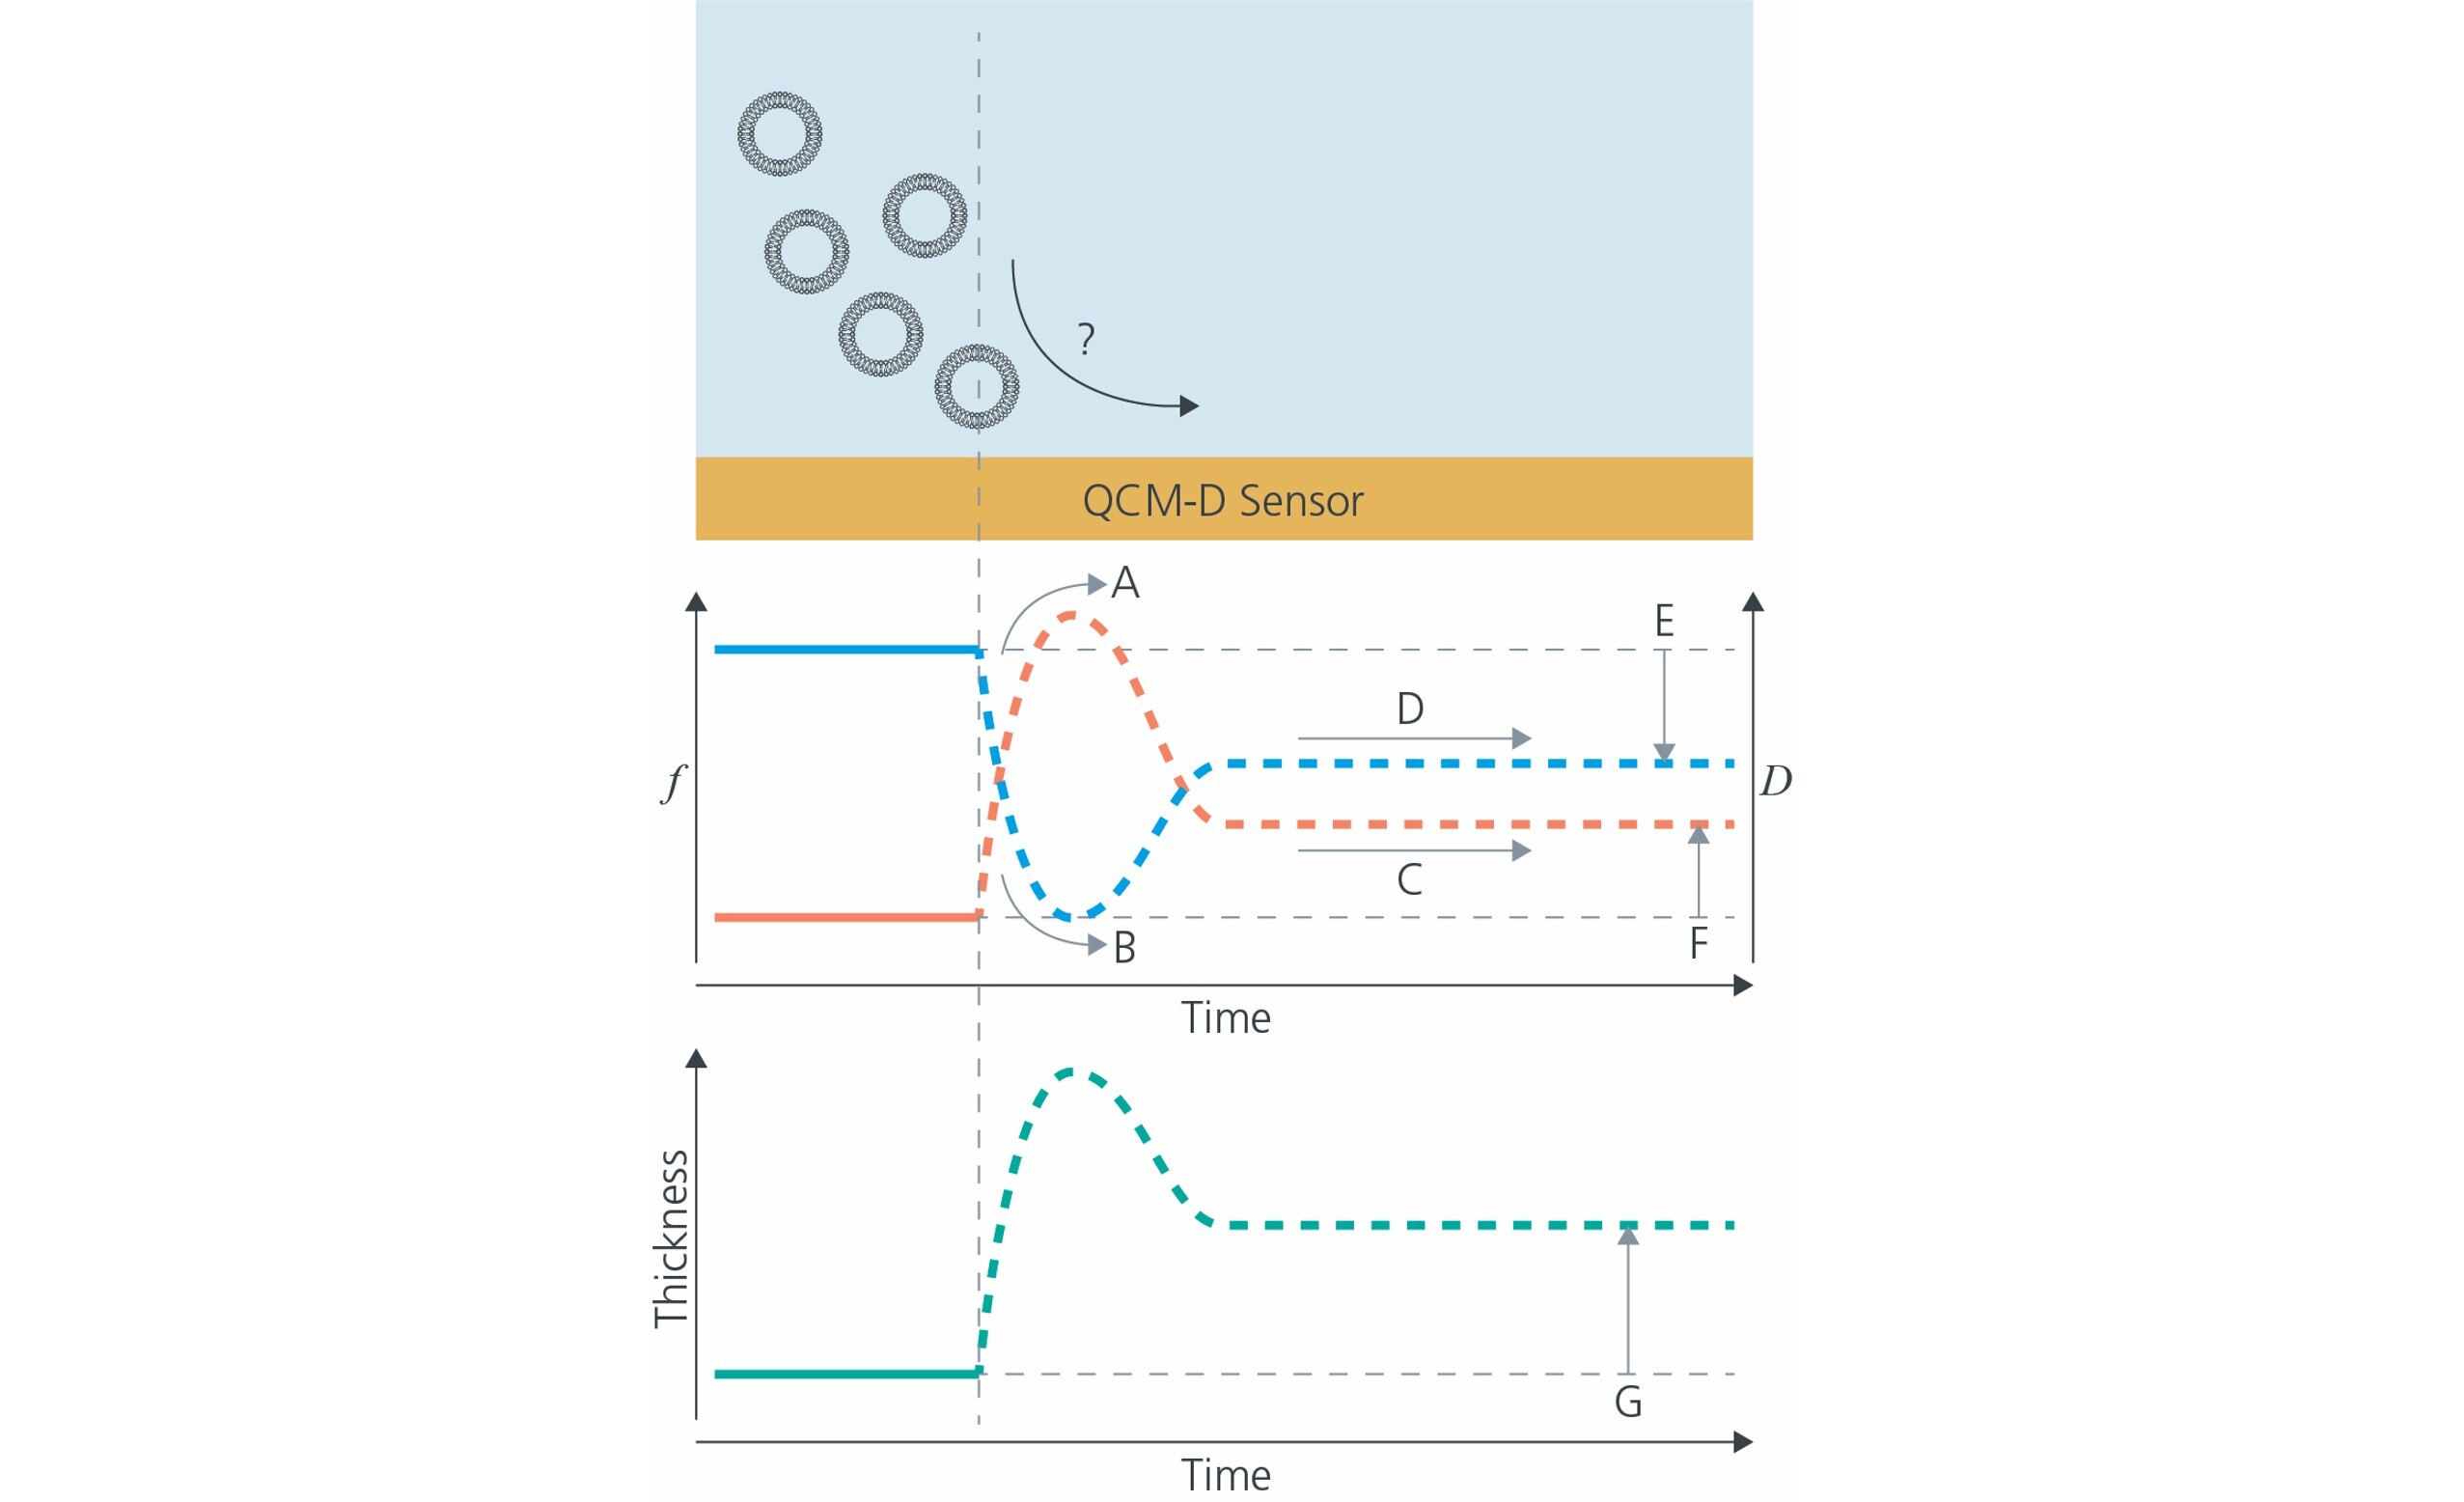
Figure 2: Using QCM-D, questions related to the bilayer formation dynamics can be answered and the layer can be characterized. For example, are the vesicles rupturing (A, B)? What is the lipid bilayer formation dynamics (A-D)? What is the quality (E, F) and thickness of the supported lipid bilayer (G)?
While this post focuses on lipid bilayer formation, it’s worth noting that QCM-D is a powerful tool for a wide range of biointerface science applications. For example, it can be used to:
These capabilities make QCM-D a cornerstone technology for anyone seeking to understand and engineer biological interfaces.
Download the overview to read more about how QCM-D is used in the analysis and characterization of supported membrane platforms and other lipid model systems.


Malin graduated in engineering physics in 2006, where her research focused on the QCM-D technology. Since then, she has been scrutinizing the how’s and why’s of the world in general, and the world of QCM-D in particular.
