The overall goal with any experiment is information output, and the analysis output will be no better than the input. Successful data analysis therefore starts already in the lab. So why not make sure you get the most out of the time spent running experiments, and collect as much info as you can while you are at it? Here we list three simple ways that can help you get the most out of your QCM-D data collection.
Three important parts of a good data set – start, middle, end
For the data set to be high quality and straightforward to analyze, we must make sure that it captures as much information as possible about the process that we would like to analyze. We also want to minimize the presence of other processes that may compete with the phenomenon that we are interested in. To do this, we must pay careful attention to the entire measurement execution, i.e., the baseline, when to stop the experiment, and which harmonics to include in the measurement.
-
Let the baseline stabilize
As we discussed in a previous post, a successful measurement starts with a good baseline. If the baseline is not stable, the time spent on the rest of the measurement could be wasted since you cannot be sure what is going on. It is therefore important not insert any samples until the baseline is stable. I. e., let the measurement run until it has stabilized, and then wait for five additional minutes, before adding the sample.
-
Do not terminate the experiment too early
The measurement shown in Fig. 1 fulfills the requirements of a stable baseline. So, is this good data then? No, it is not. This data set has another problem - the experiment was stopped before the process of adsorption was stopped. If you look at the slope at the end of the measurement, it is hard to draw any conclusions. You can only say that after so many minutes, this amount has adsorbed but not how much will adsorb in total, when the surface is saturated. For this, you need to let the curves level out, to be stable. Then, the process on the surface is over and you can rinse and stop the experiment. That would make more sense.
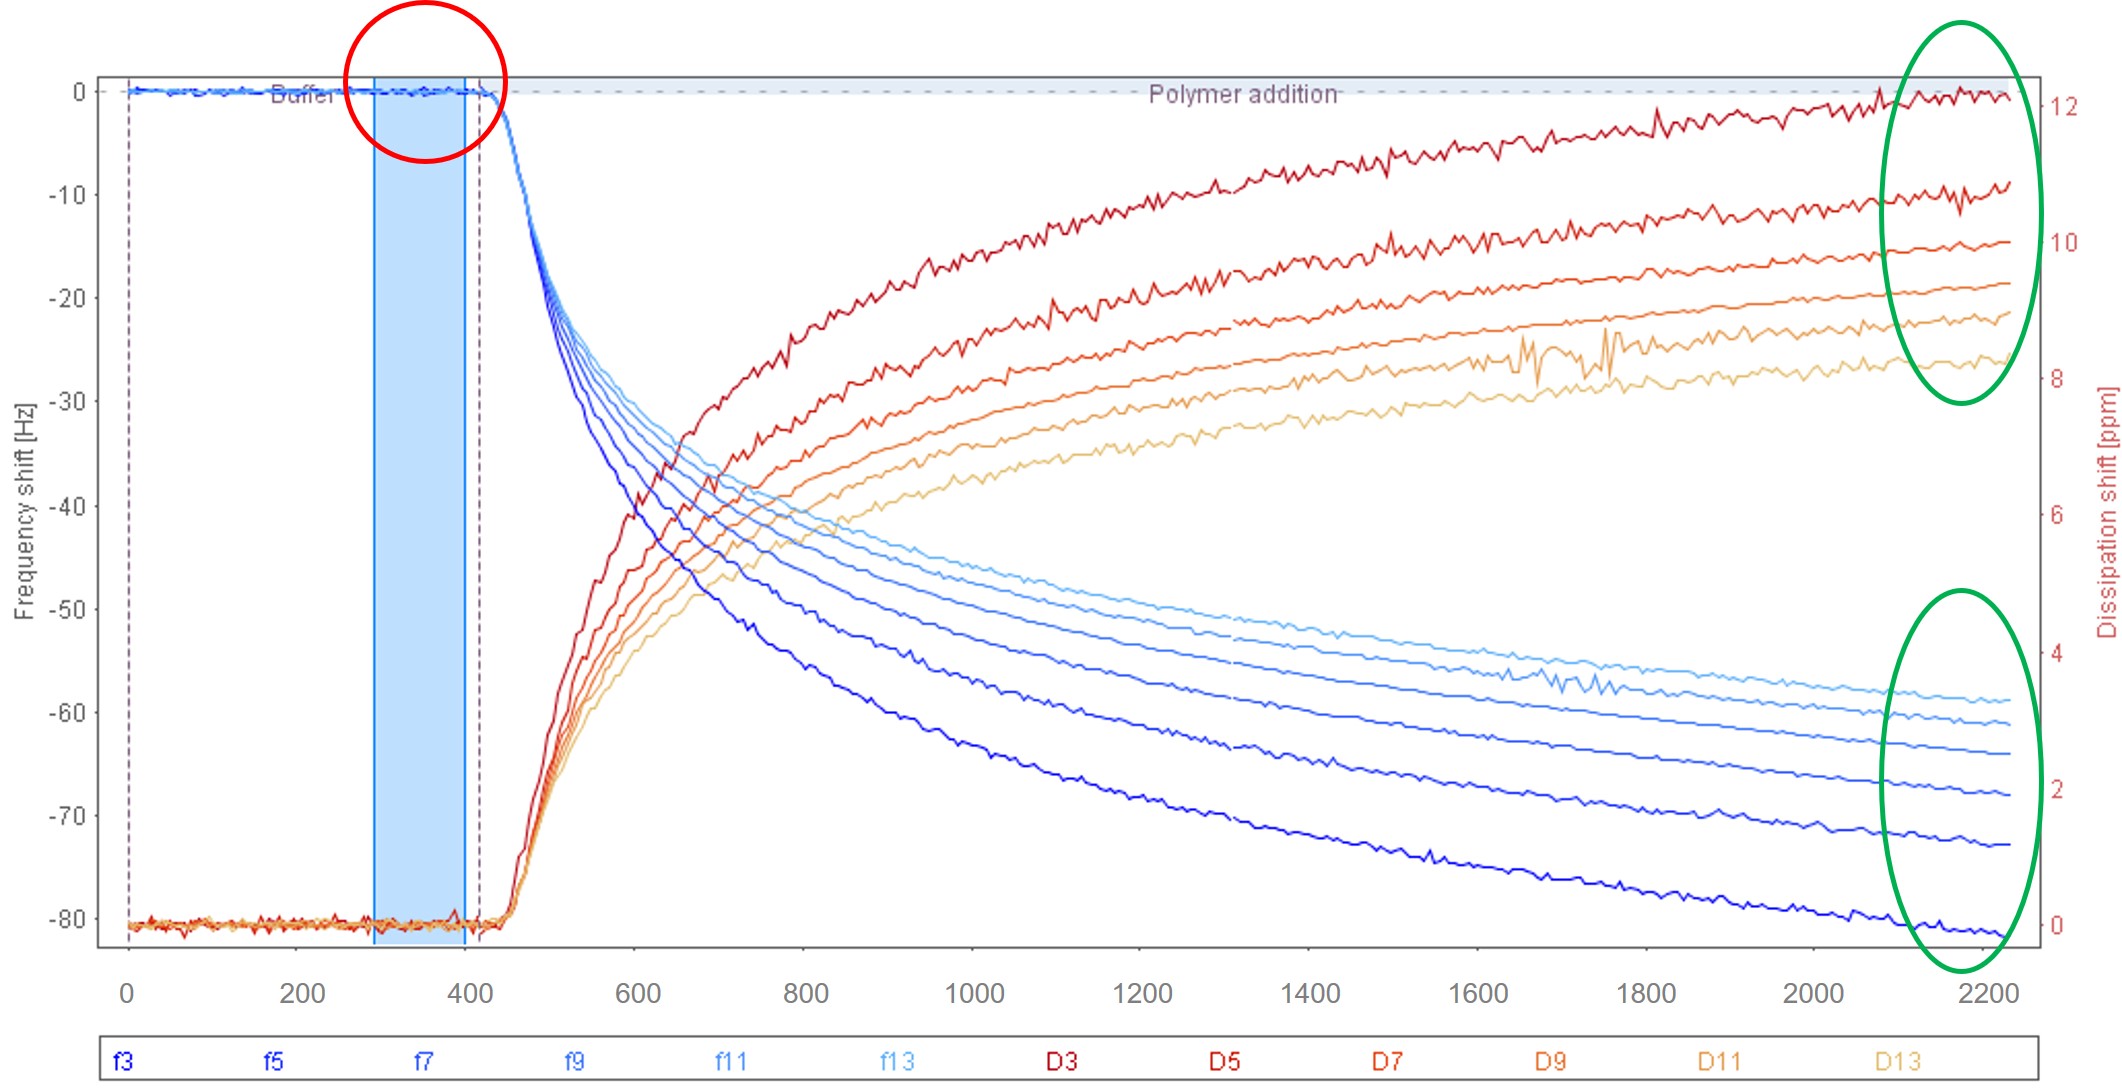
Figure 1. QCM-D data, exported from QSense Dfind, showing a stable baseline of a good length. The reference placement is also good. However, the process has not stopped when the measurement is terminated.
In some cases, it can of course be interesting to stop in the middle of the process. Let us say for instance that you want to know how much material is adsorbed after 10 minutes because that is the time the product is allowed adsorb “in the real world”, perhaps in some step-by-step protocol. This is only in rare cases though. Aim at letting the process come to an end, that is, let the curves stabilize before you rinse and stop the measurement.
-
Include as many harmonics as possible
Fig. 2A shows a data set that looks perfect. The baseline is flat, and the curves are stable. However, in this graph, the f and D curves from the fundamental frequency was excluded. When we include the data from this harmonic, Fig. 2B, we get even more useful information. It is true that sometimes you hide the fundamental since it looks a bit different than the others, or a bit ugly but it is always good to record it and to take a look at it, to assess its behavior.
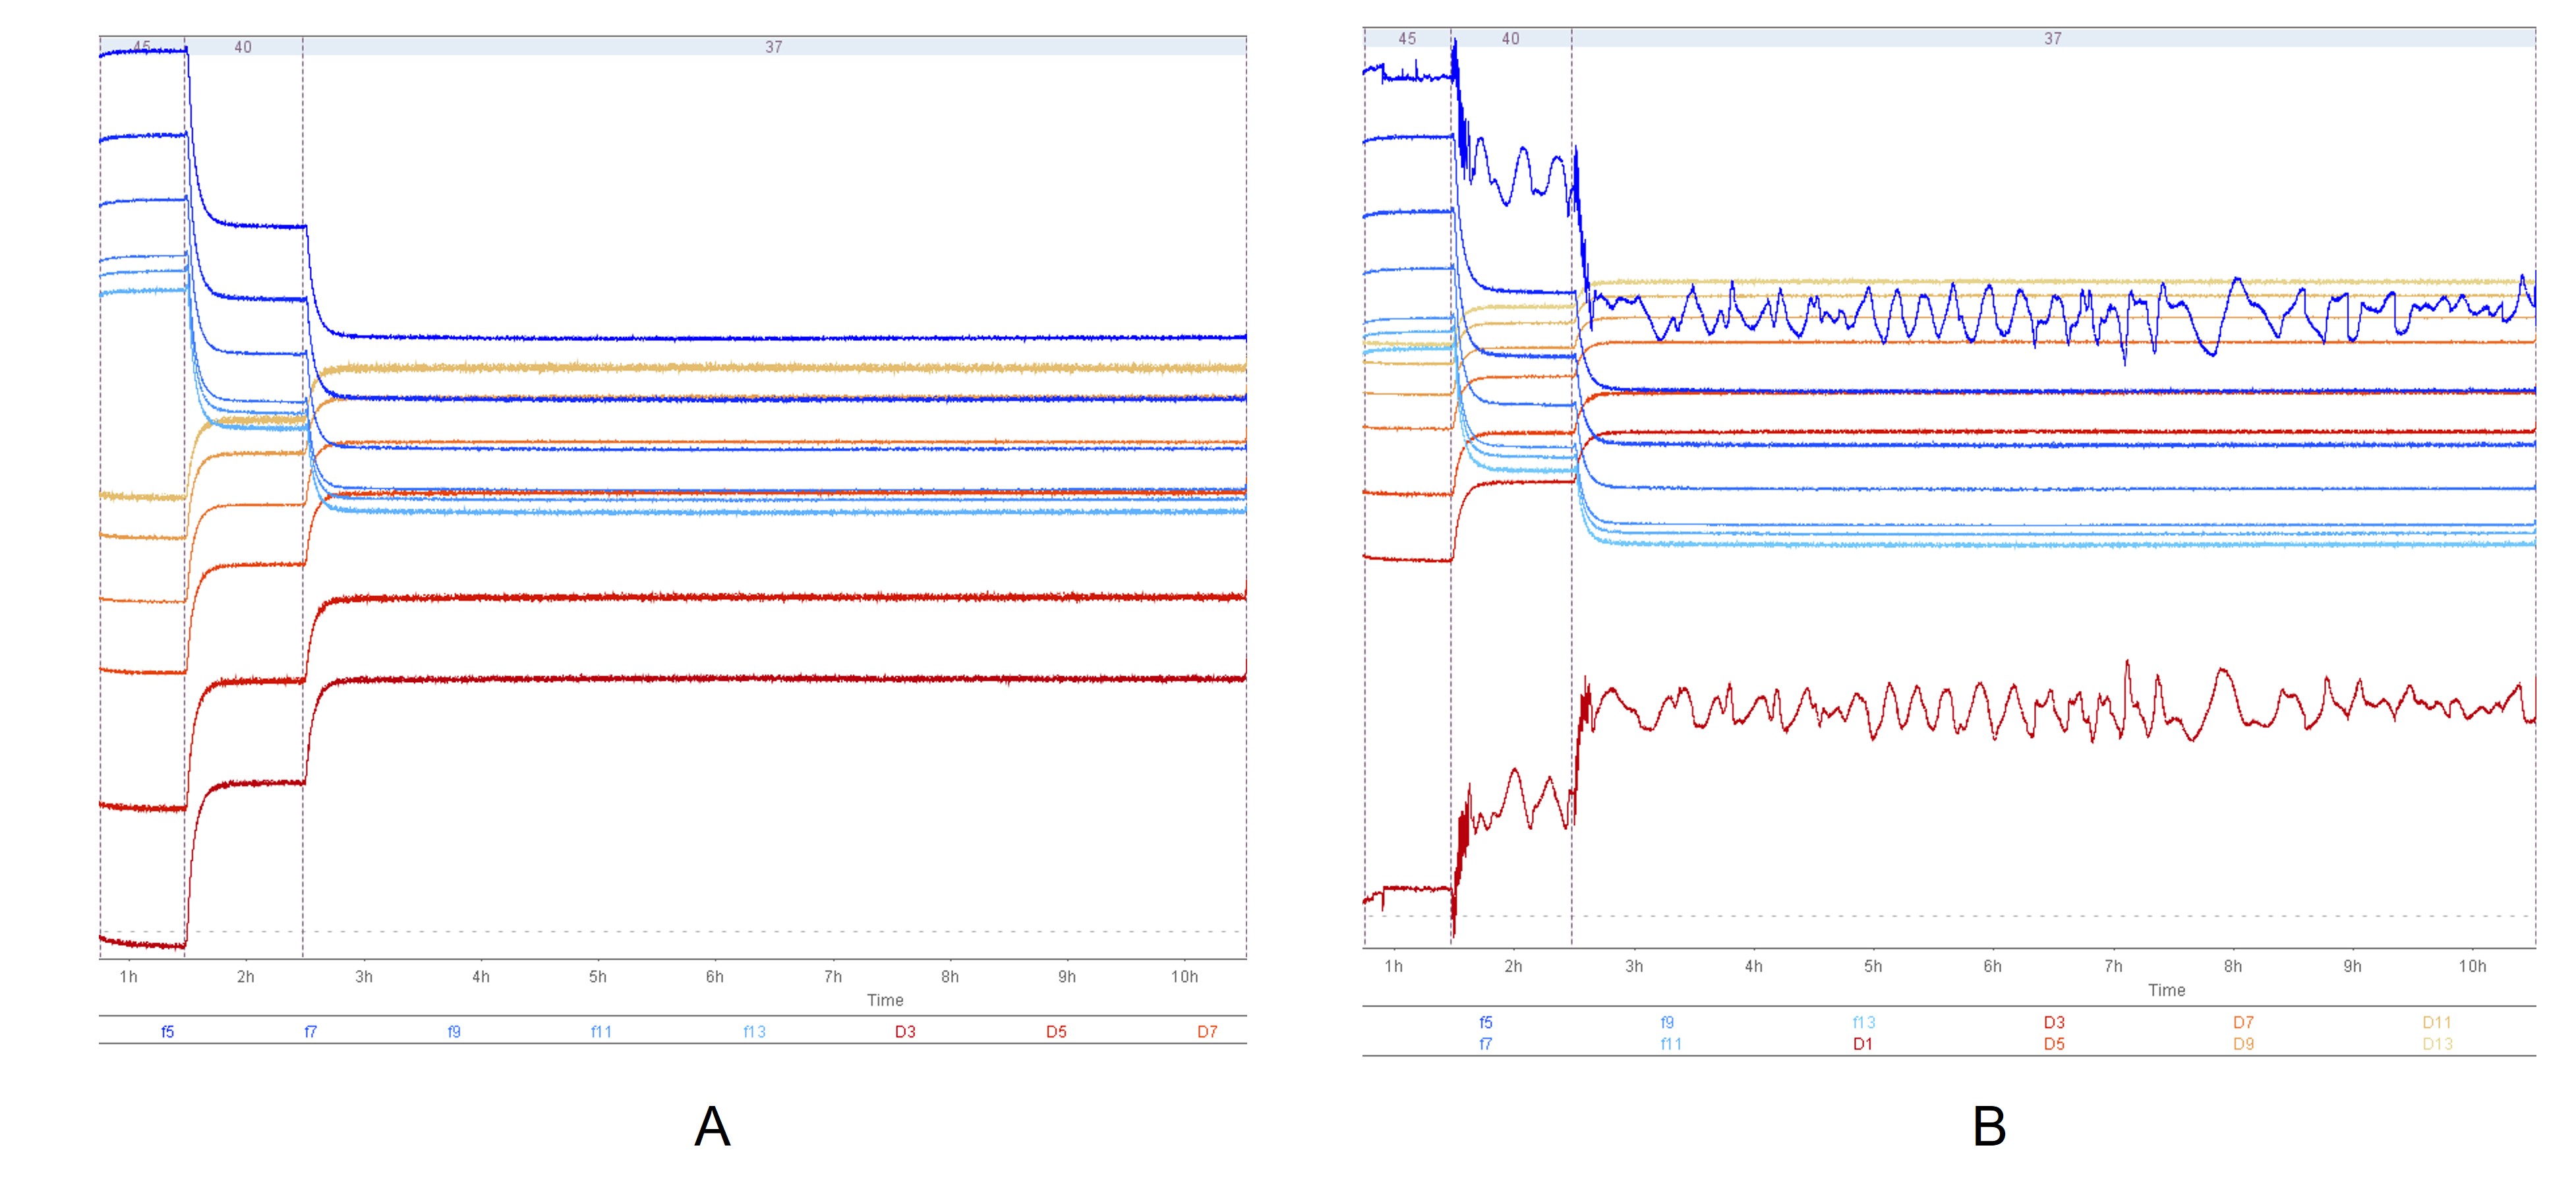
Figure 2. QCM-D data, exported from QSense Dfind, showing a stable baseline of a good length. In A), all the harmonics are not included. Including f1 and D1, B), reveals more information about the experiment. In this case, including these fundamental curves shows there most likely is a small bubble at the edge of the sensor. This bubble can start moving on the sensor to give rise to a sudden and large signal disturbance of the perfectly looking harmonics during the experiment.
Taking a look at the fundamental, Fig. 2B, we note a saw-tooth pattern. This tells us that most likely there is a small air bubble oscillating at the edge of the sensor. This bubble can suddenly, in the middle of the experiment, start moving on the sensor surface and thereby destroy the perfect looking data also from the other harmonics. So, please be careful, and take a look at what the fundamental frequency tells you.
Concluding remarks regarding collecting quality data
High quality data is a prerequisite for successful data analysis, and successful data analysis therefore starts already in the lab. Make sure you get the most out of the time you spend in the lab running experiments by starting well, ending well, and collecting as much information as possible there in between. Wait for the baseline to stabilize before you insert your samples, collect information from as many harmonics as possible, and wait for the process to terminate before you end the measurement.
Learn more about QCM-D data collection at the Biolin Scientific Academy