A prerequisite of successful data analysis is good input data, and it all starts with the baseline. In this blogpost, we talk about key characteristics of a quality QCM-D baseline and how to get there.
The data analysis output will not be better than the input, and it is therefore important to optimize the data quality when performing the measurement to maximize the analysis output. A good baseline is key to be able to properly analyze the data and draw conclusions. By studying the baseline, and interpreting what it tells us, we can give ourselves the best chances of quality data. The baseline should not be too short and not drifting.
A good baseline needs to be stable, otherwise we cannot draw any conclusions from the experimental data. What is stable enough, however, depends on what is being measured. If you expect quite large shifts in the QCM-D signals, then you may not have to be as strict about the baseline as you would have to be if you are to measure very small f and D shifts.
If you look at an inert surface in water at room temperature, you can expect a drift < 1 Hz/hour for the frequency and < 0.15∙10-6 for the Dissipation. Also, the noise should be low. It should be < 0.2 Hz (S.D, standard deviation) for the frequency and 0.05 ∙10-6 (S.D) for the dissipation. For a specific experiment, however, it depends on the chemistry involved, how low these numbers can be.

Figure 1. A section of a QCM-D baseline showing a set of frequency curves.
Let us also look at some baseline examples to see if these are good or not.
The QCM-D measurement shown in Fig. 2 includes several steps, and we see both mass uptake and mass loss from the sensor surface. The baseline in this measurement is however too short to be useful. We cannot say anything about the baseline when it looks like that. For example, we cannot be sure that the baseline is not drifting, and thereby affecting the rest of the measurement. Therefore, we cannot say much about how trustworthy this data is. To be able to trust that there is no drift or significant processes in the background that interferes with the measurement, the baseline should be stable for at least 5 minutes.
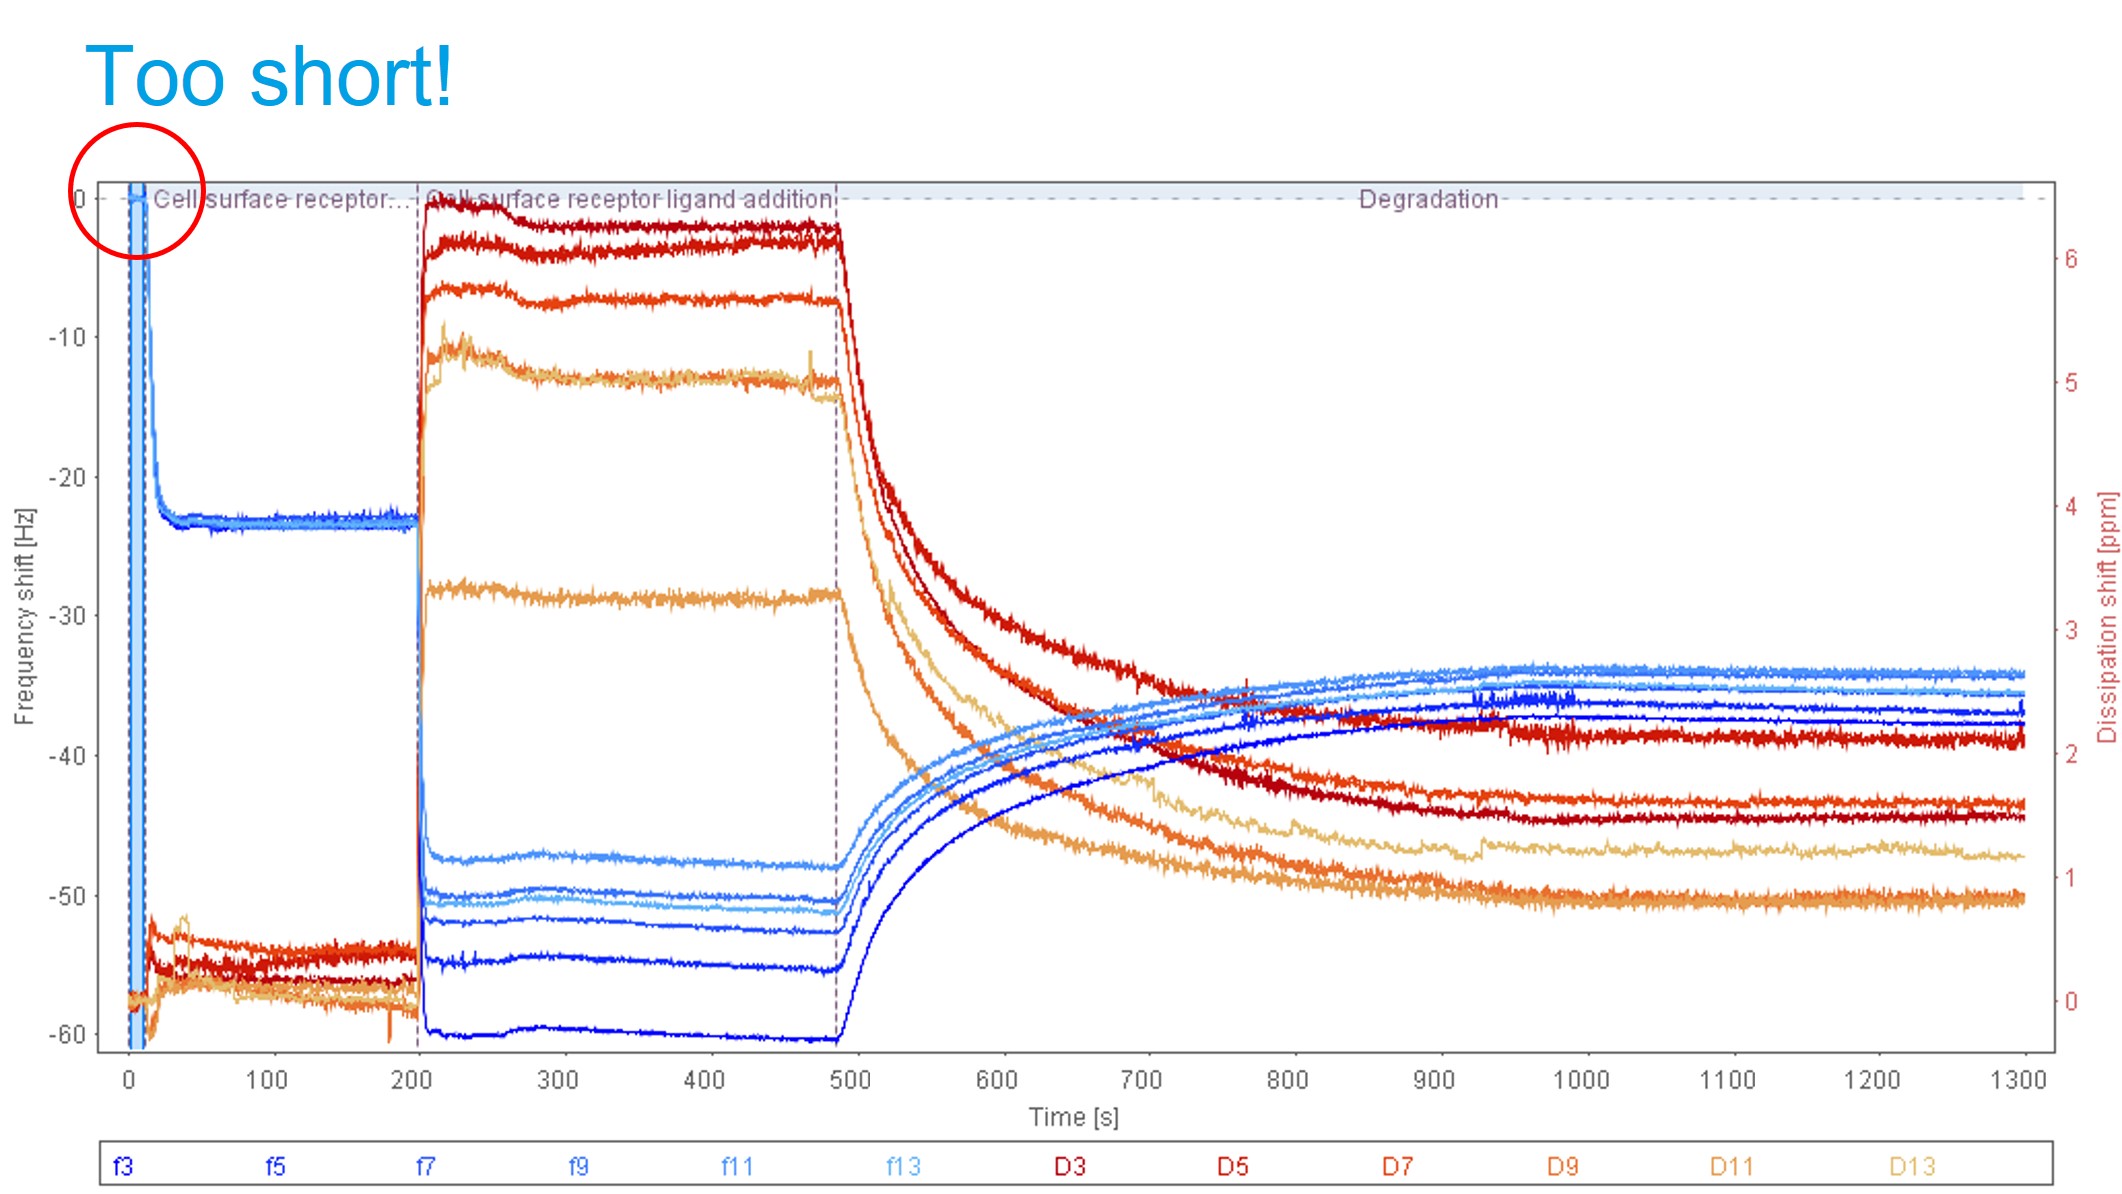
Figure 2. QCM-D data, exported from QSense Dfind, showing a baseline that is too short.
In Fig. 3, we see a measurement of polymer addition to a surface. In this measurement, the baseline is drifting. We therefore cannot really say anything about the results. We cannot assume the drift in the baseline would have been the same throughout the measurement. Perhaps the drift was due to some contaminant that was adsorbing for a while and then normalizing. Perhaps it was due to temperature adjusting. Perhaps the reason for drift was contaminants being rinsed off the sensor surface. Since we cannot know what the reason of the drift is, we cannot draw any conclusions about results when starting with drift. The measurement should not have been started until the baseline was stable.
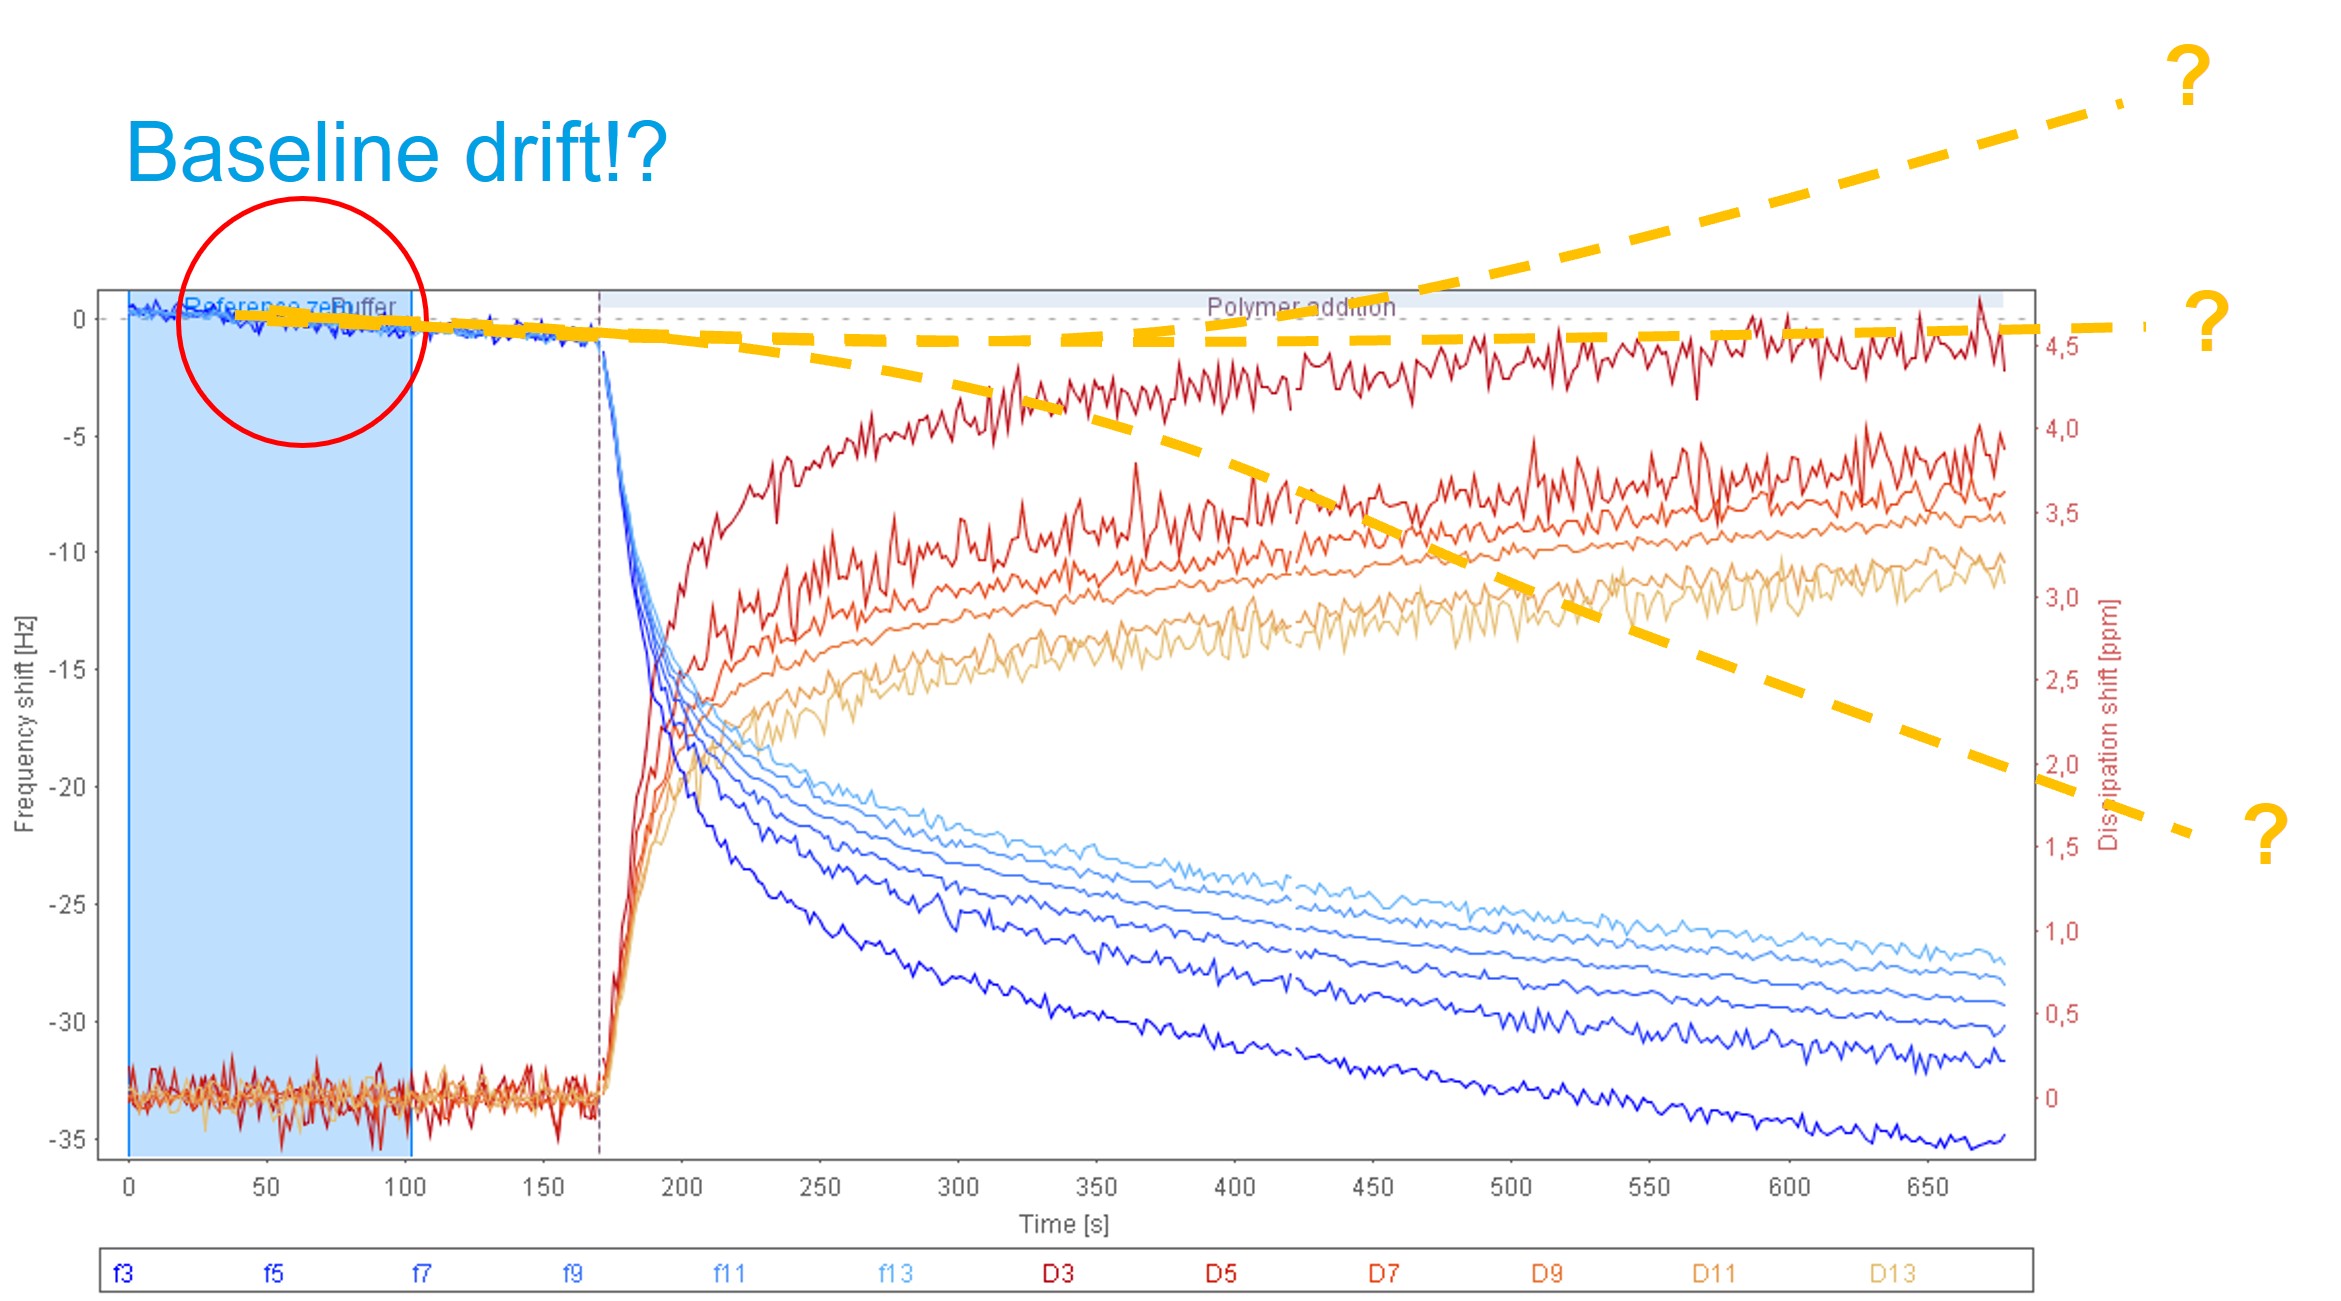
Figure 3. QCM-D data, exported from QSense Dfind, showing a baseline that is drifting.
So, how should you handle a situation where you see this kind of drift when you start the measurement? What you need to do is to rinse longer to see if you can achieve a better baseline. If the baseline does not stabilize over time, you need to consider if your instrument, sensor, buffer, and accessories were clean enough. Any contaminants will affect your results and is something you want to avoid at any time.
Good data is a prerequisite for successful data analysis - the analysis output will not be better than the input. A good baseline is key to be able to properly analyze the data and draw conclusions. The baseline should not be too short and not drifting
Download the guide to learn more about how to optimize the baseline so that you can get the most out of your collected data.

Jennie Ringberg is a former employee at Biolin Scientific. She was the Global Technical Product Manager for QSense and also held roles as Application Specialist for QSense, In-House Sales Manager, and Academy Manager. Jennie holds a Master of Science in Bioengineering from Chalmers University of Technology and spent the first years after graduation focusing on membrane proteins and how to identify and characterize these in the best way.