The reliability and value of the information offered by analytical equipment is important to draw conclusions and progress the scientific work. Since its birth, QSense QCM-D has provided researchers and scientists with a new set of eyes and allowed for many new insights and discoveries. Data quality has always been our top priority. Proud to maintain our premium position and sharp edge, we have now released the 4th generation QSense QCM-D which does not only provide a sharper tool in the scientist toolbox, but also simplifies data interpretation.
To stay ahead of peer competition and to keep up with the research frontier, the data on which conclusions are based and on which decisions are made must be trustworthy and provide value. The data must be reliable and reproducible, and it should be free from artifacts. You should be able to rely on the fact that you measure what you think you measure, and not something else. For example, in the case of QCM-D technology, which is extremely sensitive to temperature changes, temperature stability is crucial since uncontrolled temperature change could be misinterpreted as mass change. It is also imperative that the instrument can capture all processes and properties that are of interest to analyze or characterize. Both fast and small events should be detectable with confidence, and the equipment should allow for all samples and solvents of interest to be analyzed.
The reliability and value of the information offered by scientific equipment can be optimized and secured by clever product design, innovation, and performance optimization. This, in combination with robust construction, will increase the chances of the product offering cutting edge data and continue to do so for years to come. Being pioneers, and world leading in QCM-D since 1999, we take pride in pushing the boundaries, exploring possibilities, and covering new grounds. Since its birth, QSense QCM-D has provided researchers and scientists with a new set of eyes and allowed for new insights and discoveries, and our ambition is to keep providing that reliable research companion.
Initially based on a patented solution that enables rapid and information dense data collection, data quality has always been, and still is, our top priority. Today, two decades later, the QCM-D technology has matured and become industry adapted. Proud to maintain our premium position and sharp edge, we have now innovated and pushed the boundaries towards an even lower Limit of Detection (LOD), faster data collection and even better data quality. The 4th generation QSense QCM-D does not only provide a sharper tool in the scientist toolbox, but it also simplifies data interpretation; sharper data means even fewer artifacts, which in turn makes data deciphering easier than ever.
QSense Omni is designed to make it easier to generate high quality and trustworthy QCM-D. Here are some of the features that have been implemented:
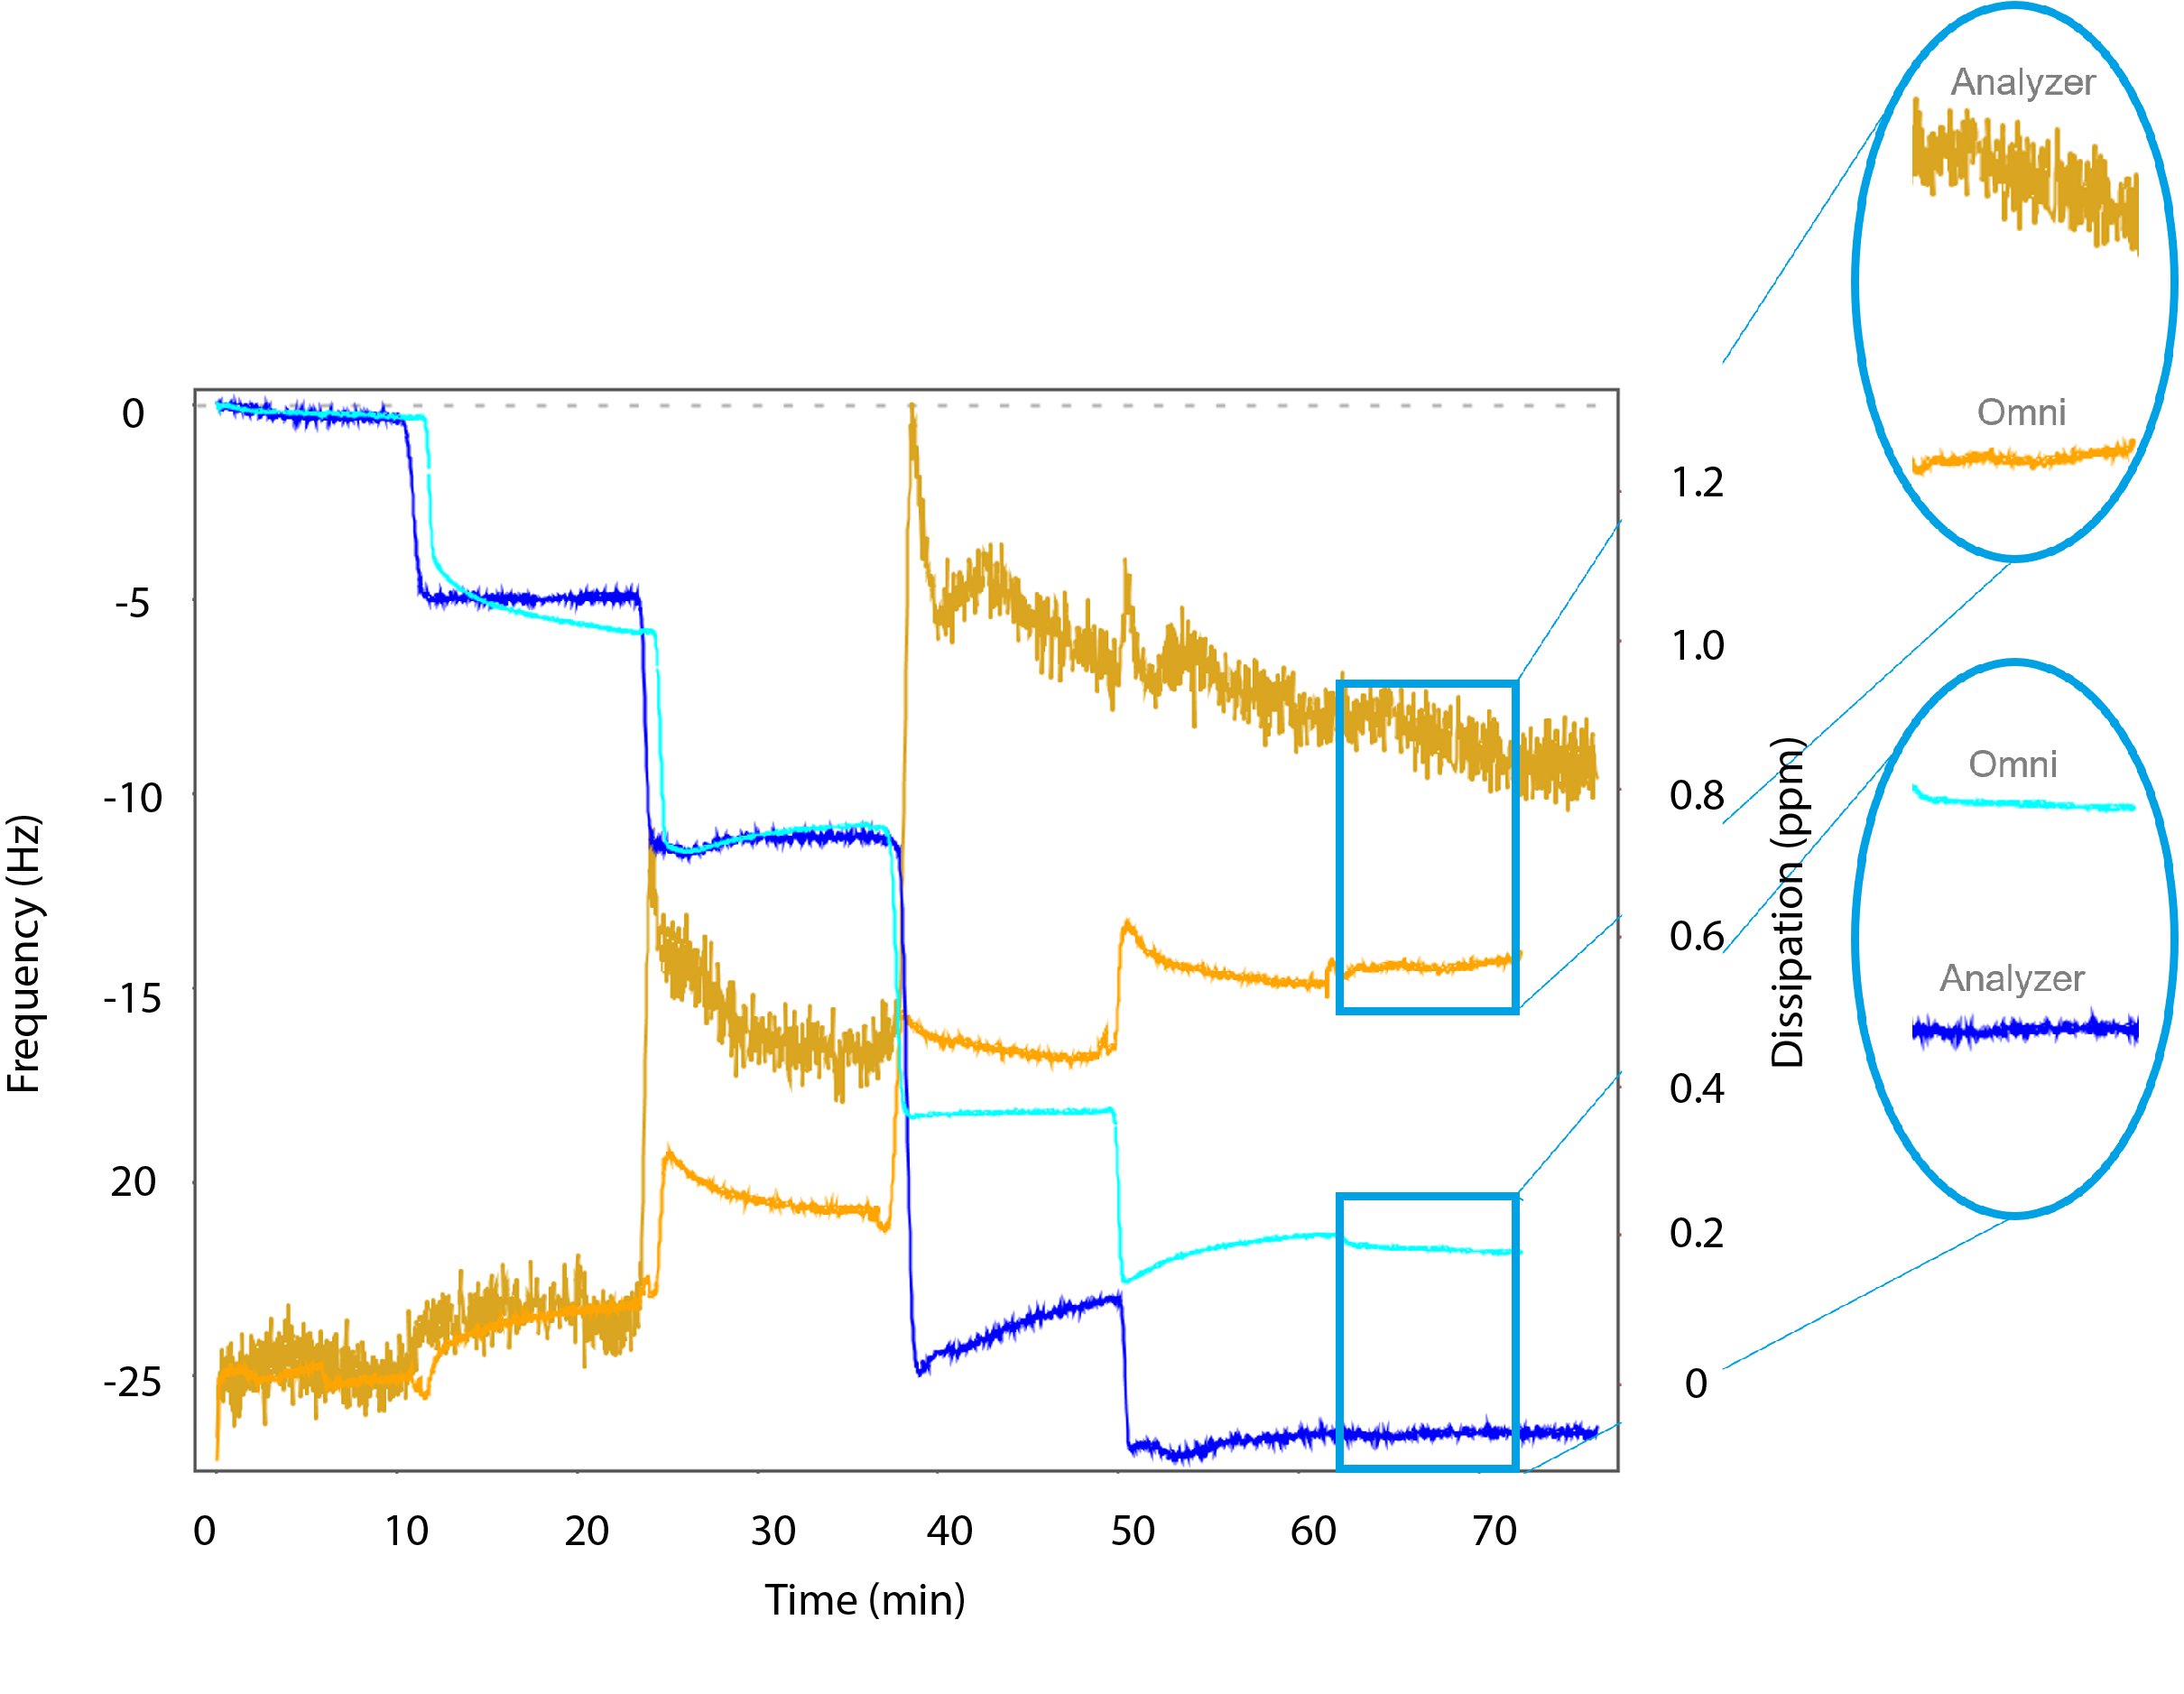
Figure 1. Multilayer build-up of polyelectrolytes in Analyzer and Omni. Frequency is shown in blue colors and dissipation in orange colors. Insert shows collected data and noise level for the two different instruments. The highly improved signal-to-noise level for Omni vs Analyzer can clearly be seen. For easier comparison of the two experiments, the flow rate in Analyzer was not compensated against Omni flow rate.
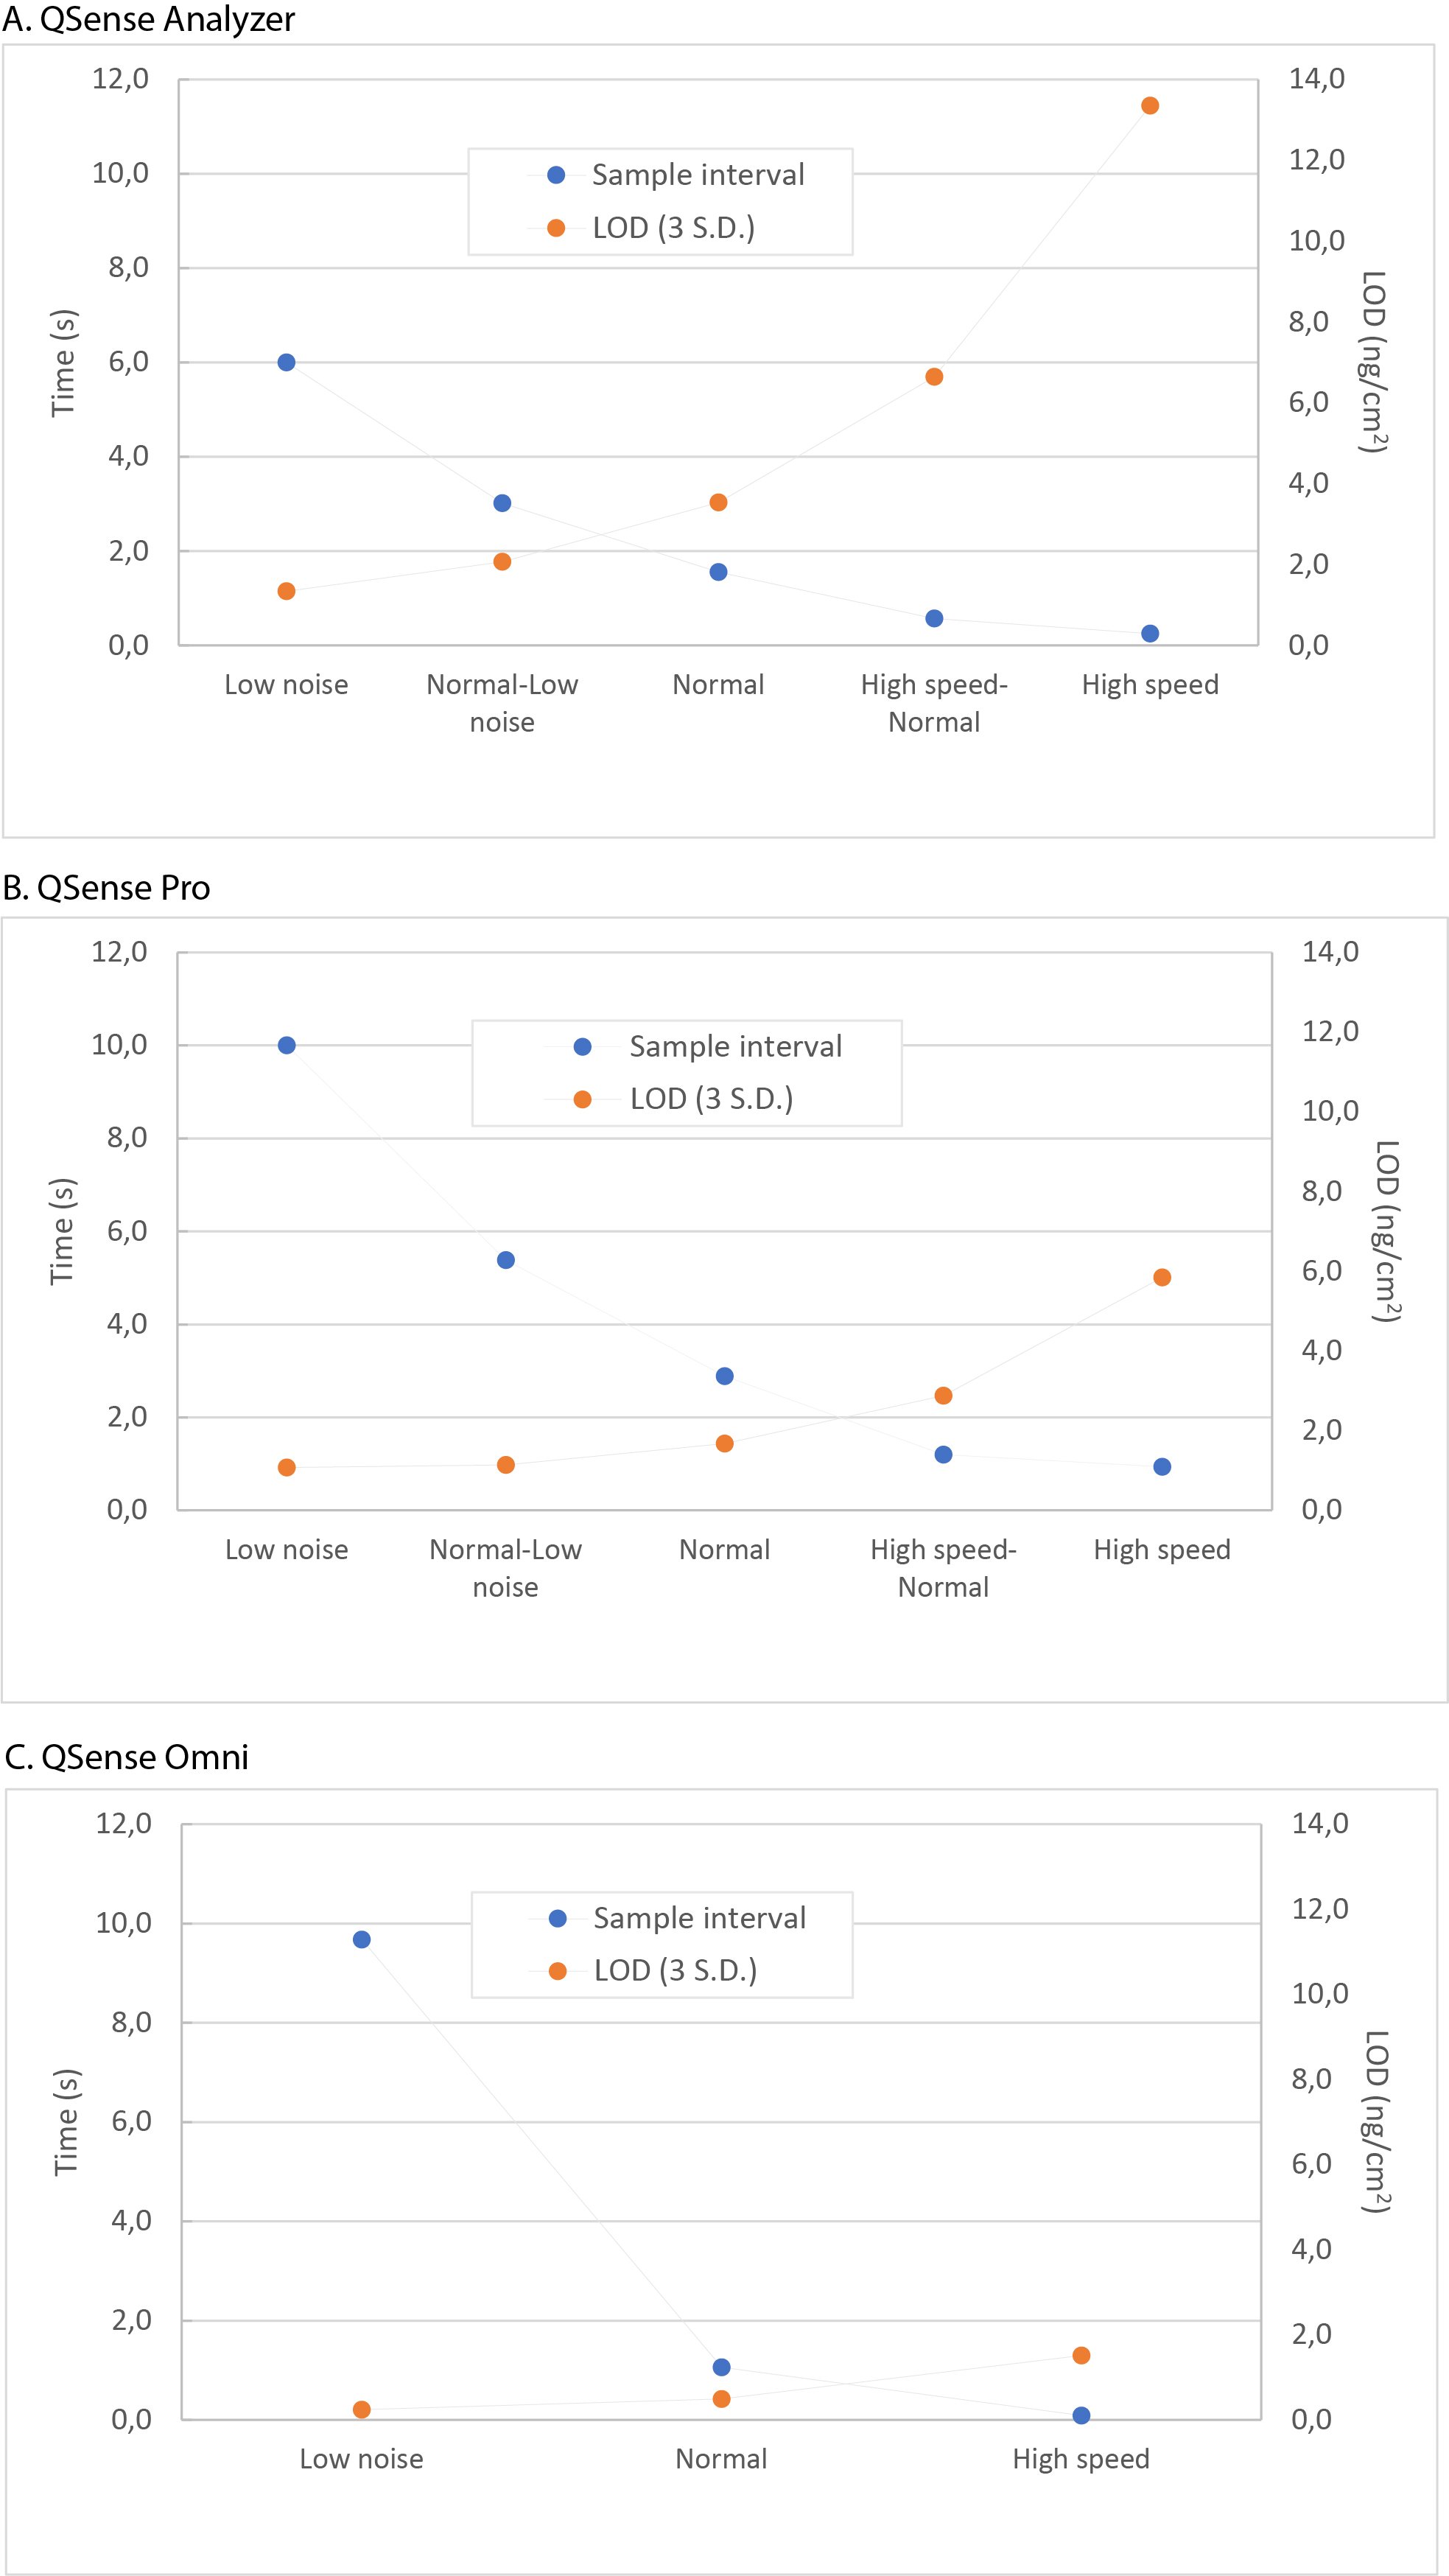
Figure 2. Profiles for speed and LOD of A) QSense Analyzer, B) QSense Pro, and C) QSense Omni. Measurements were performed with QSX 303 SiO2 sensors at 20°C, and in deionized water at a flow rate of 15μL/min. Acquisition was done for four sensors simultaneously in QSense Analyzer and Pro. Note that these results for QSense Omni are independent of number of sensors used.
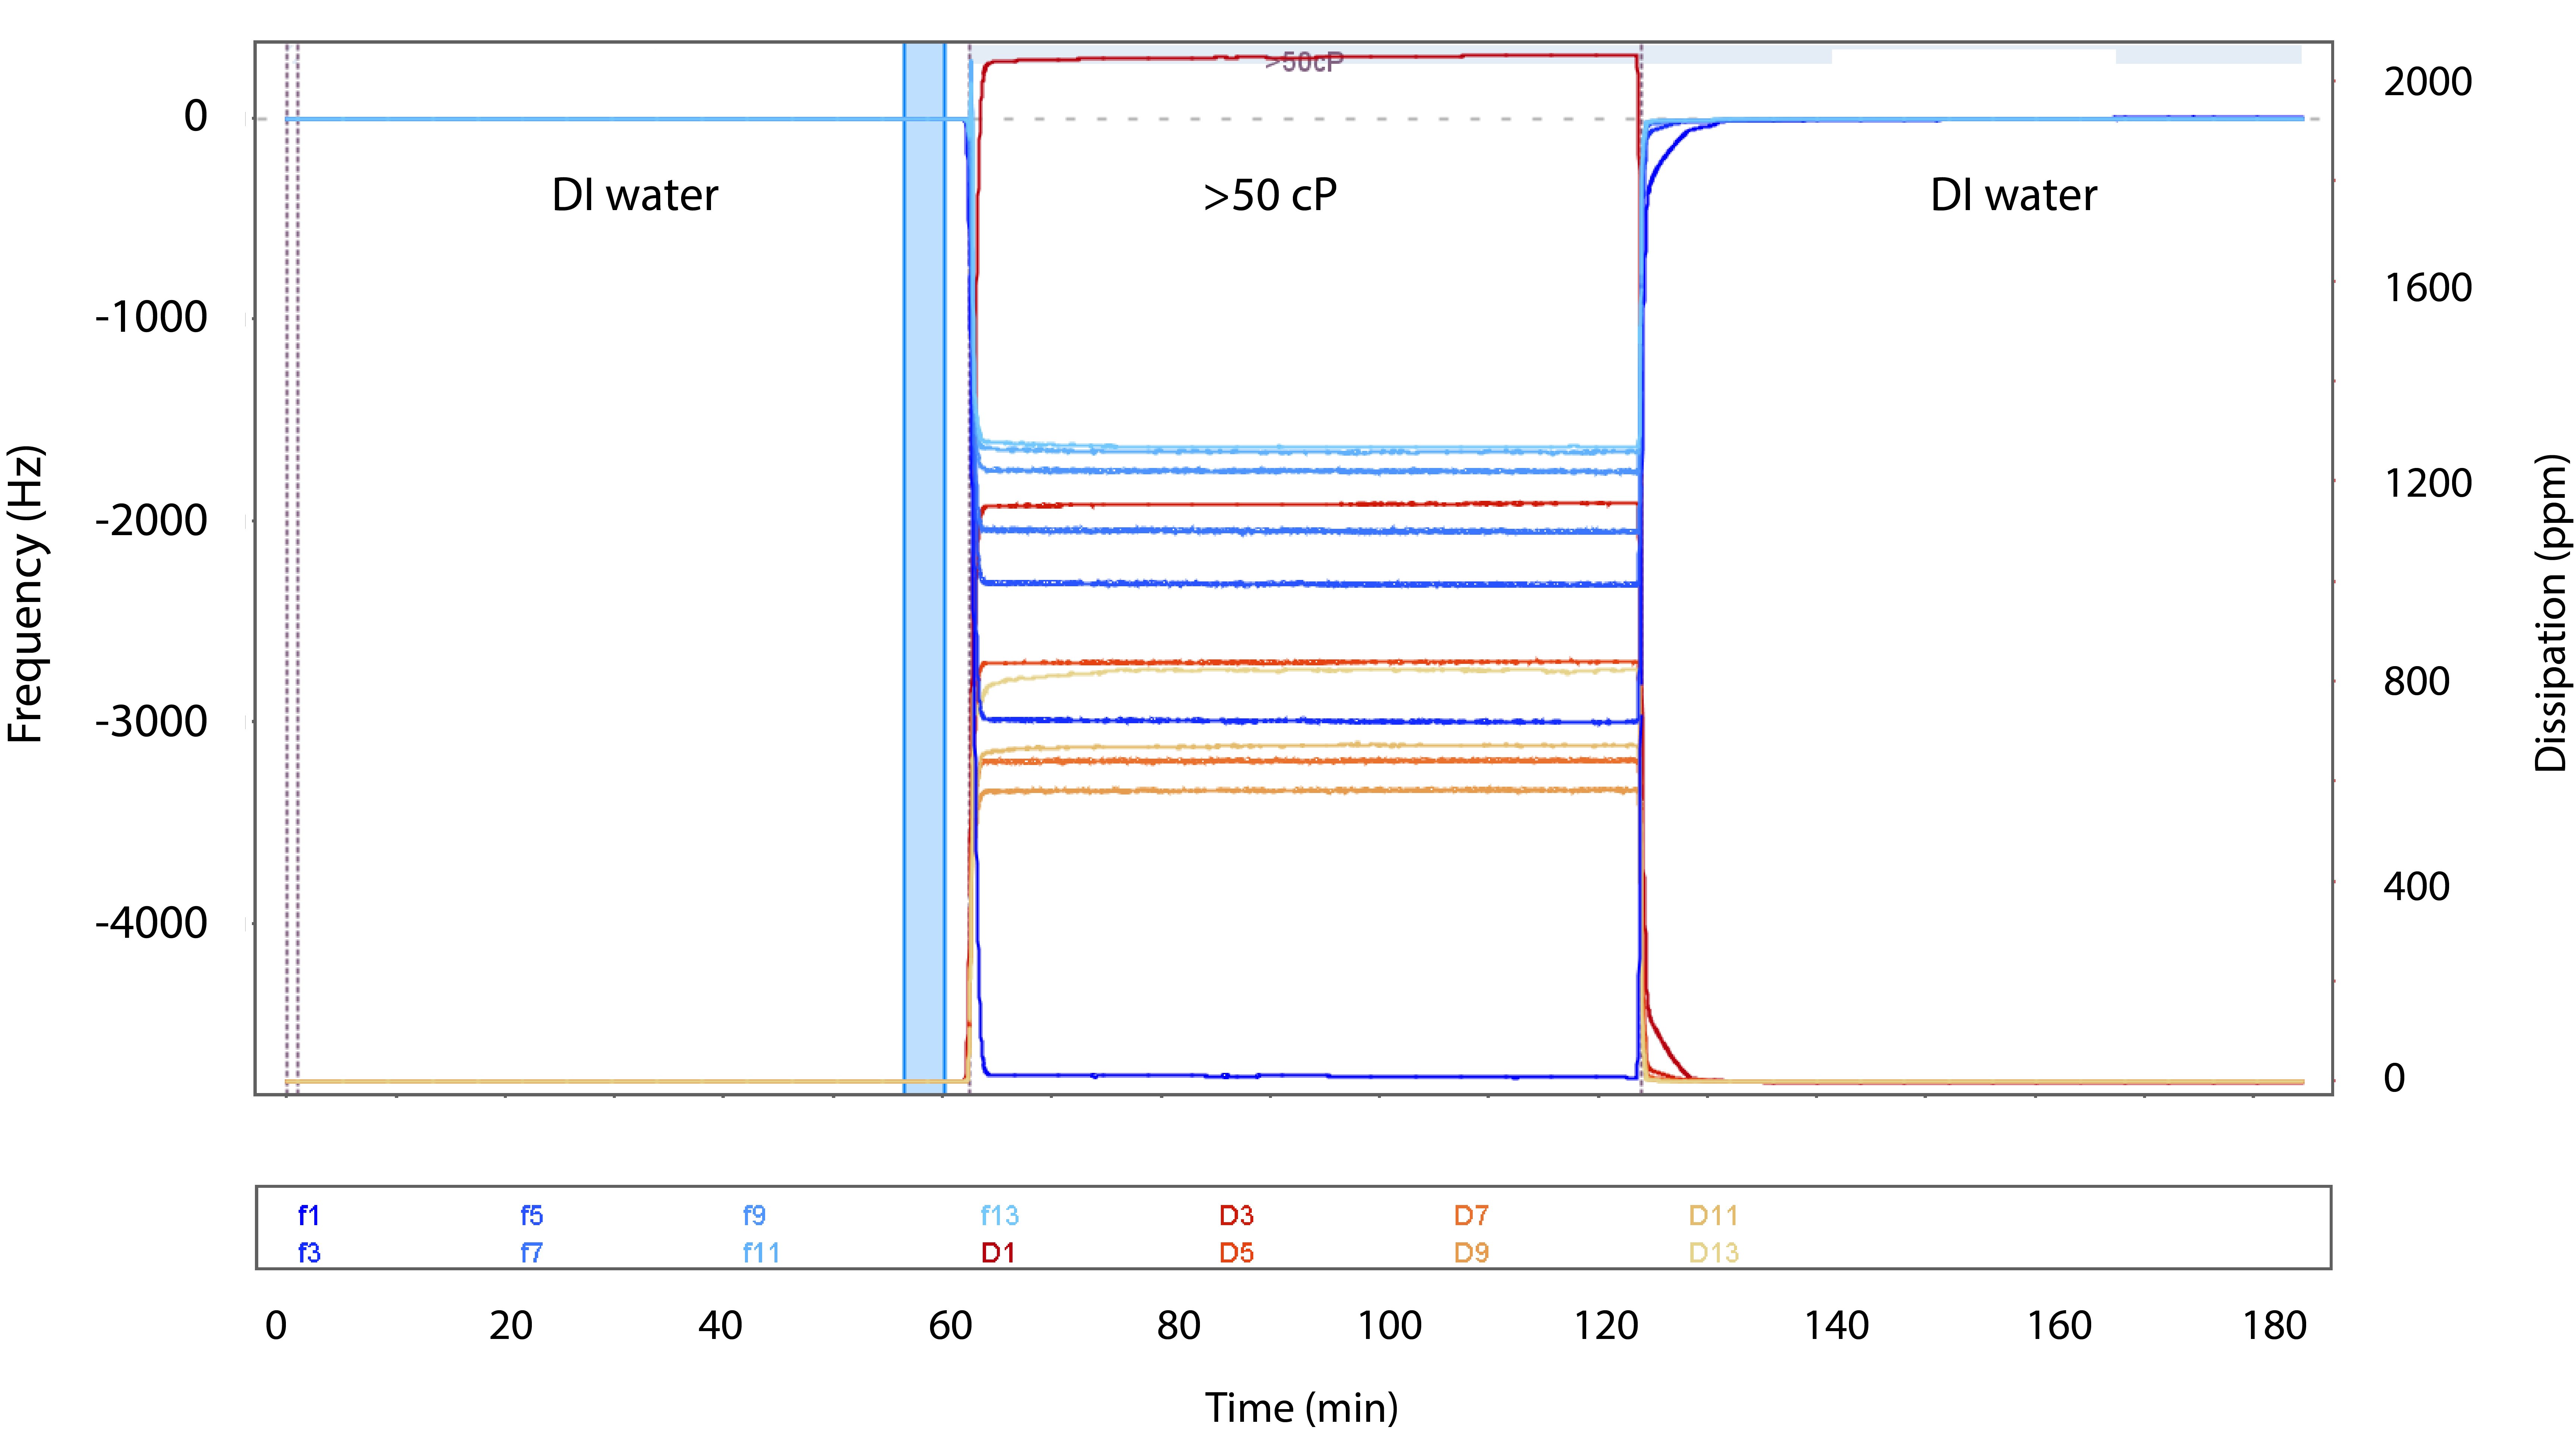
Figure 3. A graph showing a measurement in QSense Omni and the liquid exchange between low viscosity (water) and high viscosity (glycerol/ water mixture). The glycerol/water mixture was measured at a viscosity of 50.7 cP. All harmonics could be measured at the given high viscosity.
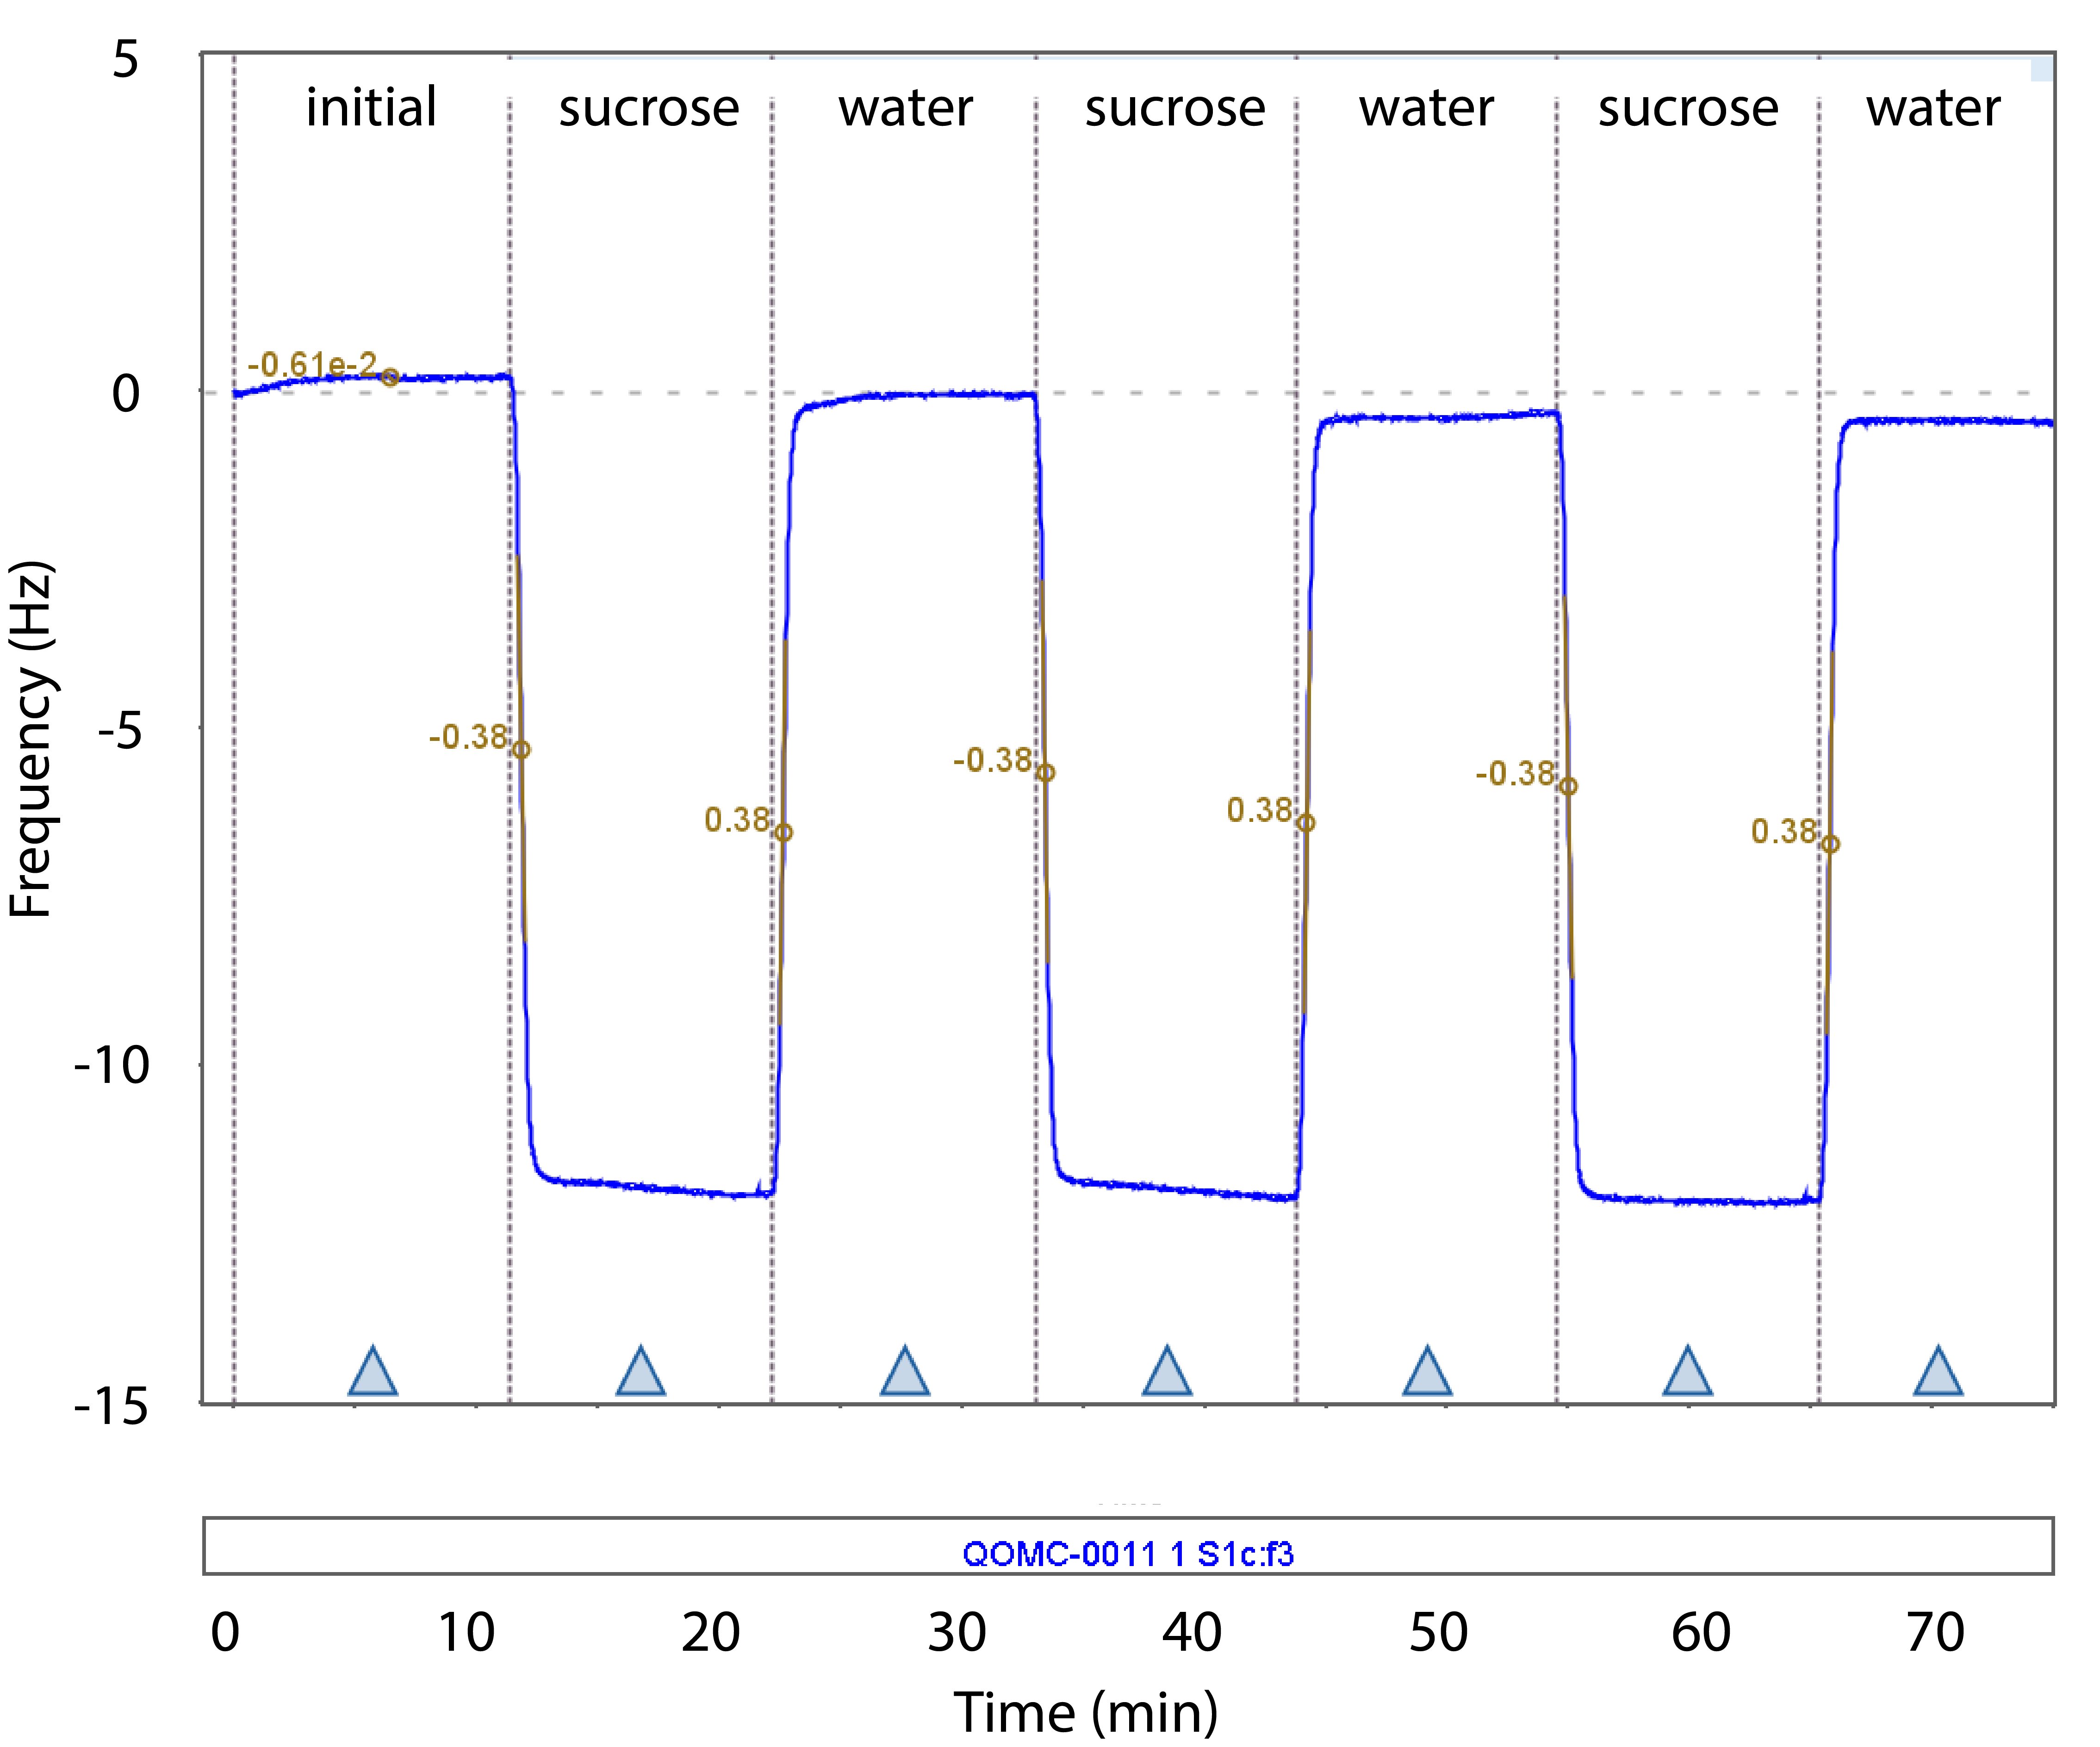
Figure 4. A graph showing a measurement in QSense Omni. The frequency trace shows the fast, sharp and reproducible liquid exchange between two solutions with different viscosity: sucrose and water. The liquid exchange slope during the ‘rise’ and ‘fall’ has been inserted to emphasize the reproducible liquid exchange (liquid exchange slope was determined to 0.38 Hz/s for all changes).
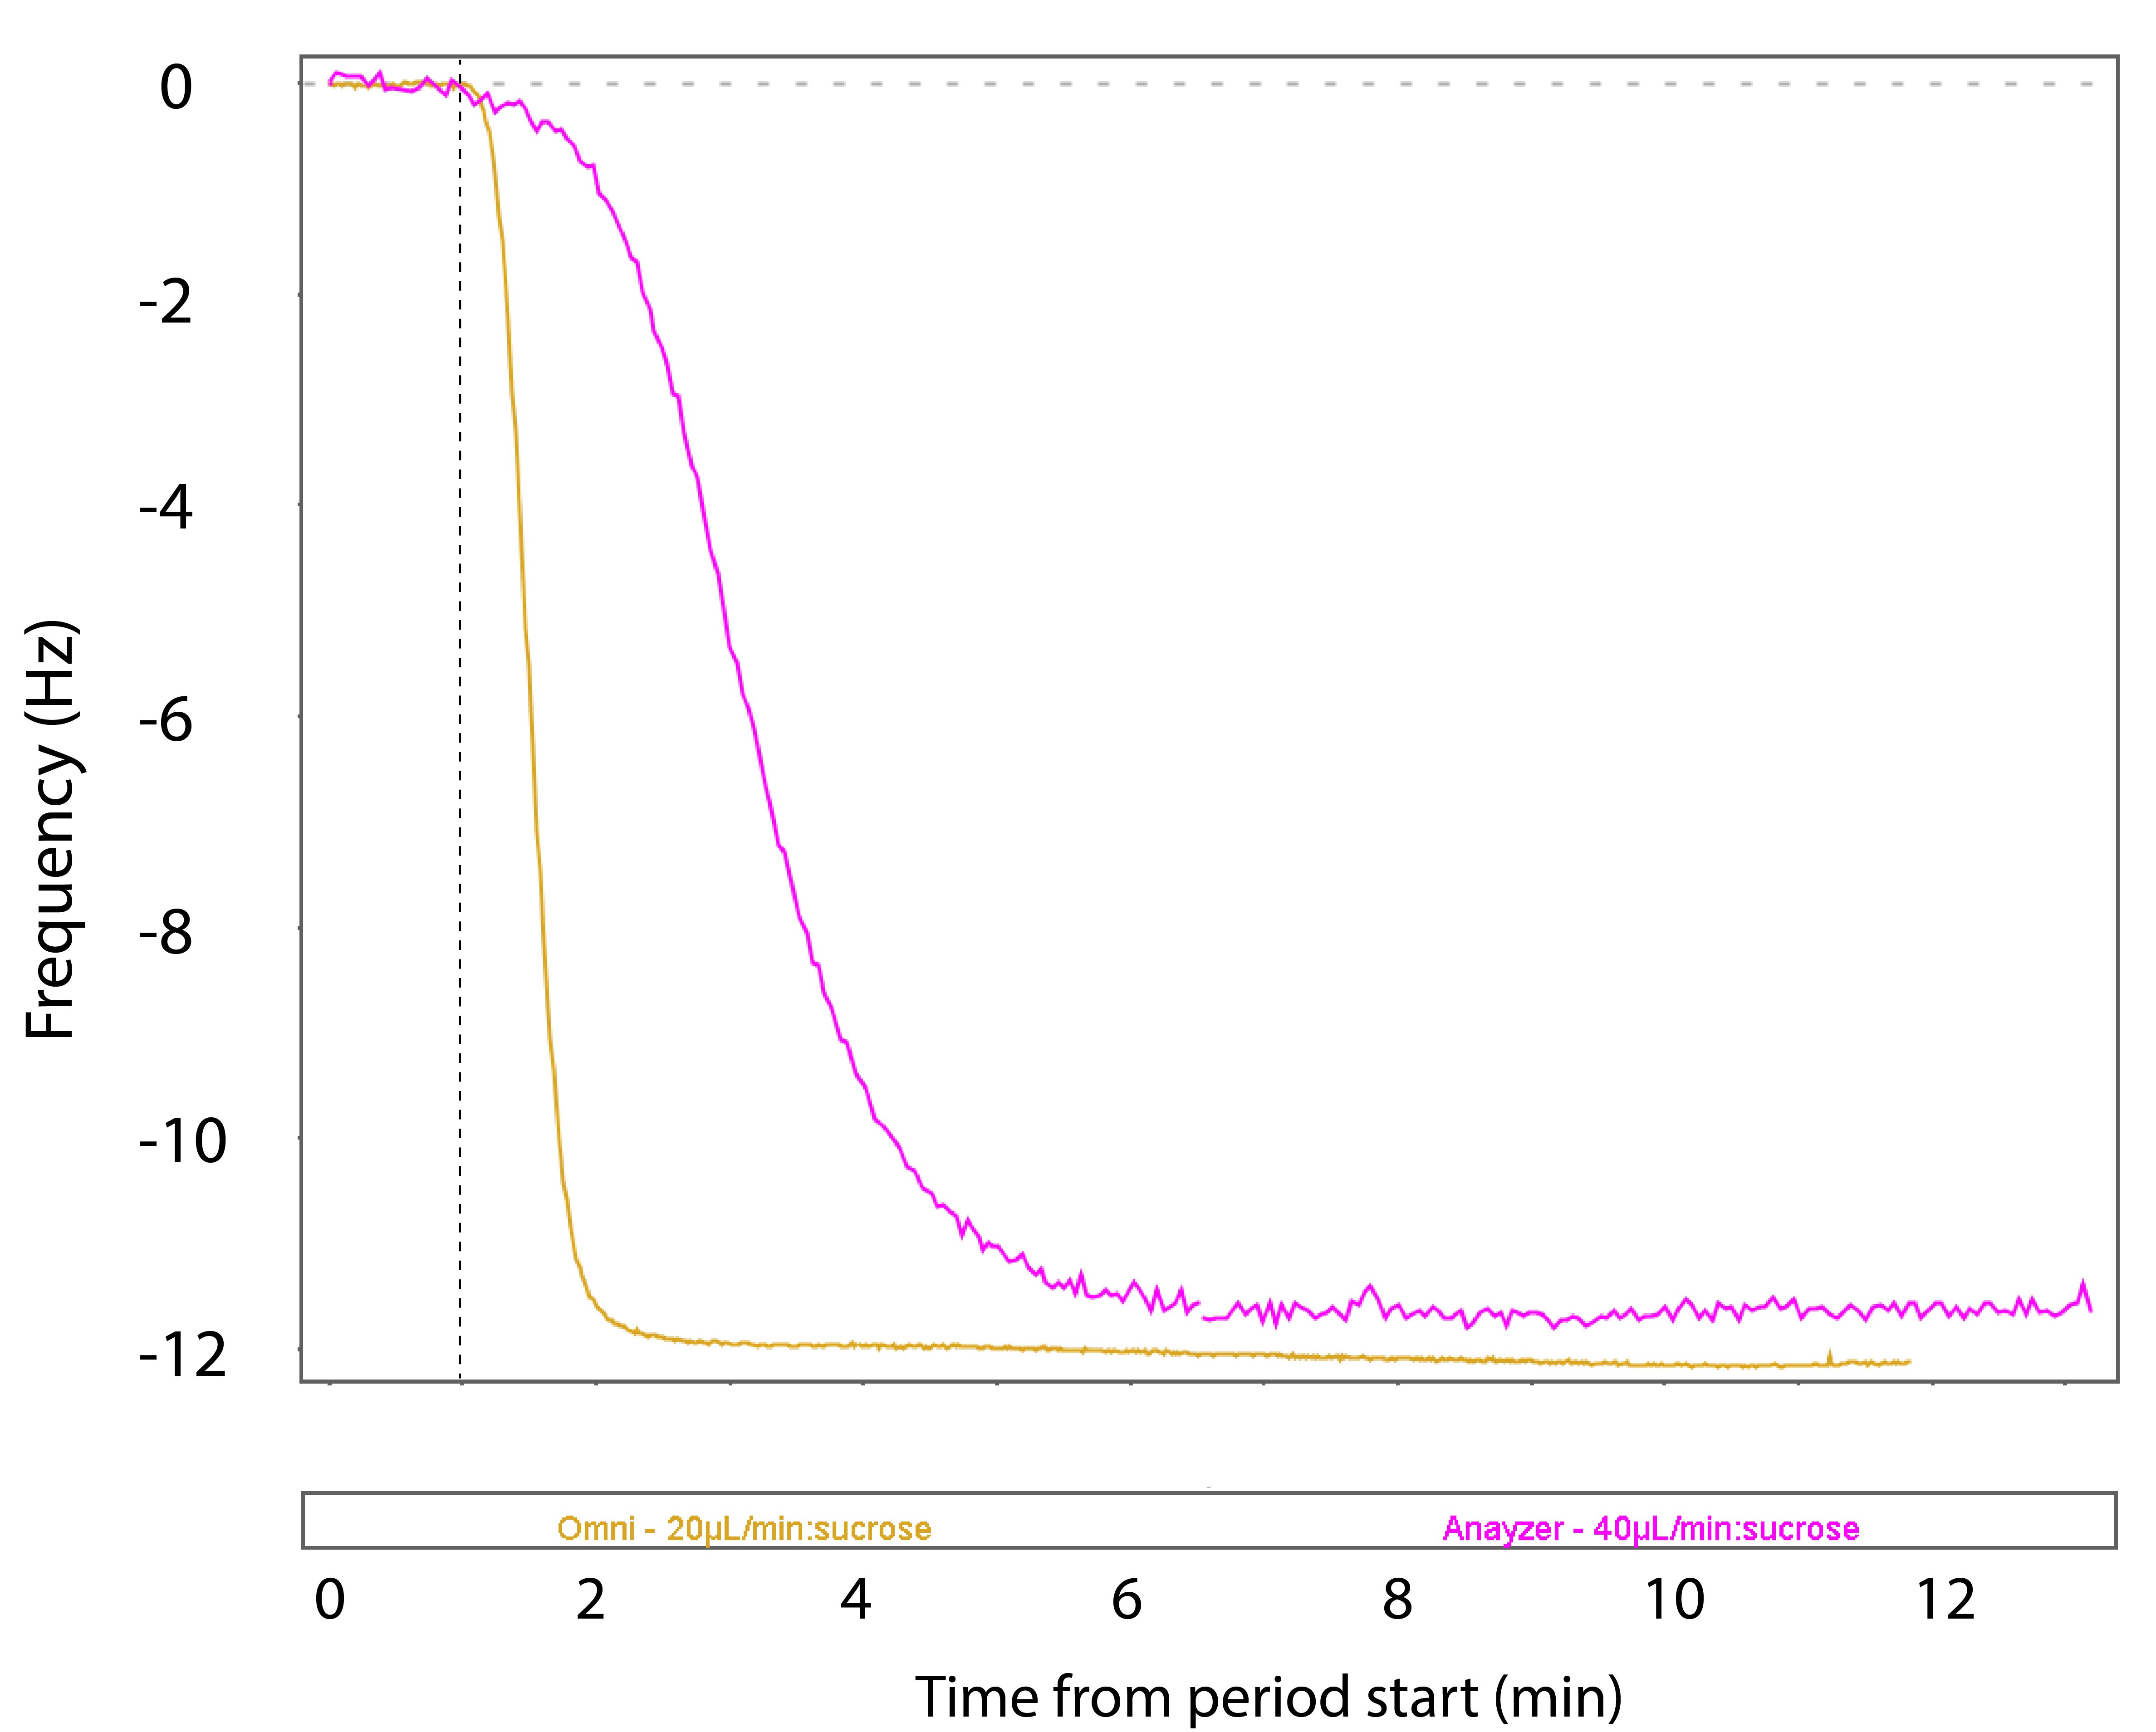
Figure 5. Comparison of the frequency shift during liquid exchange starting at the dotted line, in Analyzer (magenta) and Omni (yellow) The data shows a five times faster liquid exchange in Omni compared to Analyzer. To be able to compare the two different systems, liquid void volume was compensated for by adjusting the flow rate in the Analyzer system.
Each QSense Omni measurement channel has its own fluidics system and electronics. The sample rate of the individual channels is therefore completely independent of whether you are using one or four channels. This considerably increases the time resolution for multi-channel measurements.
Especially f, but also D, have a temperature dependence. Therefore, it is crucial to have full control of the temperature to get optimal data out of a QCM-D measurement. In QSense Omni, the integrated, patent pending, temperature control for the complete chamber, keeps both the sensor holder and sample cylinders within the same controlled temperature zone. This allows for stable temperature throughout the measurements.
To be able to draw correct conclusions and progress the scientific work, the reliability and value of the information offered by scientific equipment is important. Over the past couple of decades, QSense QCM-D has provided key data to the scientific and research community, supporting more than 3000 publications and being a fundamental tool to develop products and processes. Data quality has always been our top priority, and with this 4th generation platform we have pushed the boundaries even further. QSense Omni is designed to make it easier for scientists and researchers to generate high quality and trustworthy QCM-D data and enables detection of even smaller and faster events compared to previous generation platforms. Not only does it provide a sharper tool in the scientist toolbox, but it also simplifies data analysis and interpretation.
Download the technical whitepaper to learn more about QSense Omni features and design.

Jennie Ringberg is a former employee at Biolin Scientific. She was the Global Technical Product Manager for QSense and also held roles as Application Specialist for QSense, In-House Sales Manager, and Academy Manager. Jennie holds a Master of Science in Bioengineering from Chalmers University of Technology and spent the first years after graduation focusing on membrane proteins and how to identify and characterize these in the best way.
