As discussed in several previous posts, when running QCM measurements on soft, viscoelastic layers it is important to collect information about the energy loss. QCM-D and QCM-R are two methods that do this in different ways. Here we briefly describe the key differences between the two QCMs, and compare them side by side.
To fully describe the viscoelastic properties of a film adhering to a QCM sensor surface, it is necessary to measure all sources of energy losses, or damping, of the sensor oscillation. QCMs that measure the energy losses are based on either i) impedance spectroscopy, ii) oscillation decay time measurement or iii) measurement of the resistance of the equivalent circuit. This post focuses on the latter two approaches.
To make the explanation easier to follow, let’s start by taking a look at the equivalent circuit, a Butterworth-Van Dyke (BVD) circuit, used to represent an oscillating quartz crystal, Fig 1.
The LCR arm in the circuit (Fig. 1B), the so-called motional arm, represents the oscillating quartz crystal. The physical equivalents of the different components in the motional arm, i.e., the inductor L1, the capacitor C1, the resistor R1, are the displaced mass, the ability to store energy, and the energy losses, respectively. The static shunt capacitance, C0, in parallel with the motional arm represents the electrode capacitance of the crystal.1-4

Figure 1. A) A quartz crystal sandwiched between two electrodes. B) equivalent circuit.
The most basic QCM measurement is a pure frequency measurement. To gain more information about the adlayer than what is provided by the frequency alone, the resistance, R, of the crystal can be measured. The resistance is essentially equivalent to the resistor in the motional arm in the equivalent circuit in Figure 1B.
The resistance, R, can be measured, for example, via an advanced oscillator circuit.3,4 By introducing a small resistor and measure the voltage, the current in the oscillating circuit can be measured, Fig. 2.

Figure 2. A QCM setup with resistance measurement
If the shunt capacitance, C0 (see equivalent circuit, Fig. 1B) has been cancelled, and the crystal is operating at resonance, the current will be proportional to the resistance, R1 of the equivalent circuit. R1 will be a measure of the losses in the system, according to eq. 1. However, since L1, which is needed to quantify the dissipation, D, is not known in this type of measurement, no absolute values can be extracted, only relative data.

Should the damping of the crystal, the dissipation, change significantly during a measurement, there will also be an error caused by faulty shunt capacitance cancellation.
A benefit with QCM-R is that it is generally fast, Table 1. As we saw in eq. 1, the R parameter alone cannot be used to calculate the D. Also, when letting the QCM sensor be a part of an oscillator circuit, only one resonance frequency is measured. Hence, this method does not allow for viscoelastic modelling, and R can only be used as an indicator of the energy losses in the system. The oscillator circuits are generally sensitive to changes in stray capacitance, making it hard to obtain a stable measurement.
Another approach to extract information about the energy loss is via decay time measurements, so-called ‘pinging’. This method is based on measuring the decay time, τ, of the crystal oscillation.
In this approach, a driving signal is applied at the crystals driving frequency during a short period of time to let the oscillation stabilize. Next, the driving frequency is switched off, and the voltage decay curve is recorded, Fig. 3. The decay is numerically fitted to an exponentially damped sinusoidal, Eq. 2, which allows for extraction of f and D, Eq. 3.

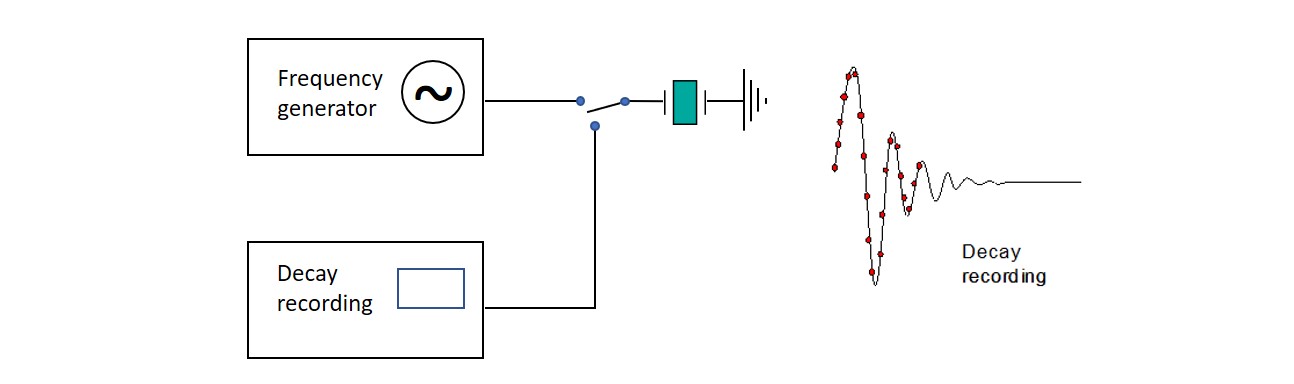
Figure 3. Principle of decay-based Dissipation monitoring. The crystal is exited into oscillation during a short time, after which the driving frequency is switched off, and the freely oscillating decay is recorded.
This type of measurement is very fast and gives both frequency and Dissipation (viscoelastic information) from the crystal.
Since only one decay recording is necessary to determine both frequency and dissipation, the acquisition is very fast. Since the acquisition rate is very high, it is possible to record several harmonics with good data quality, which, in turn, enables high-resolution kinetic studies and viscoelastic modeling.5 Additionally, the short circuit mode practically eliminates the interference from the shunt and stray capacitance, which greatly improves measurement stability. Compared to QCM-R, this setup is more advanced and therefore usually more expensive.
Key information on measurement output and application suitability is briefly summarized below in Table 1.
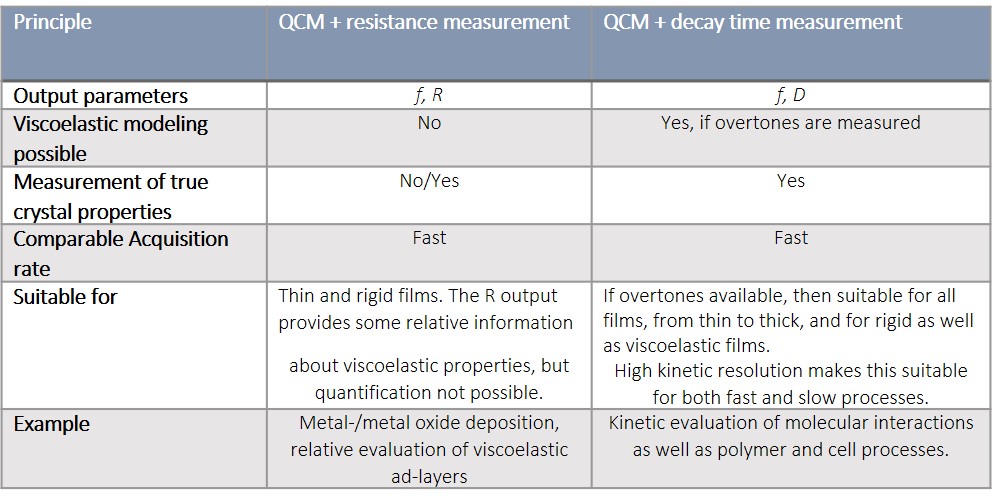
Table 1. Comparison of QCM-R and decay based QCM-D
In order to completely describe the viscoelastic properties of a film adhering to a QCM sensor surface, it is necessary to measure all sources of energy losses, or damping, of the sensor oscillation Both QCM-R and decay based QCM-D collect information about the energy loss in the system under study. However, whereas QCM-D measures all losses, the resistance measurement only contains part of the picture and thus cannot be used for viscoelastic modelling. It can, however, be useful for systems for systems where energy losses are insignificant, or qualitative analysis is sufficient.
Learn more about different QCM:s and how they compare, in the overview below.

Malin graduated in engineering physics in 2006, where her research focused on the QCM-D technology. Since then, she has been scrutinizing the how’s and why’s of the world in general, and the world of QCM-D in particular.