Polymer layer conformation and the degree of hydration are key parameters influencing the interfacial properties. The build-up of thin polymer layers, conformational changes and molecular interaction with polymer films can be analyzed using QSense QCM-D technology. Here we show how.
Polymer brushes and polyelectrolyte multilayers are used in many applications where there is a need to tailor the interfacial properties and to promote a certain interaction with the surrounding environment. QSense QCM-D is a surface sensitive technology which has been used for almost two decades to analyze polymer-based systems, and, as stated in a recently published review by Easley et al1, it is a powerful tool to monitor film growth, material adsorption, thin film swelling, and ion exchange.
In brief, QCM-D collects time-resolved information on mass, thickness, and viscoelastic properties of surface adhering layers, and this allows for monitoring of the build-up of polymer layers, as well as for analysis of molecular interaction with the polymer film formed at the QCM-D sensor surface. Since QCM-D senses the hydrated mass, i.e., the mass of both the polymer molecules and the coupled solvent, it is an excellent technology to analyze polymer-based systems where the layer conformation and degree of hydration are important aspects to obtain the targeted interfacial properties. Monitoring the hydrated mass enables not only detection of layer build-up and molecular interaction with the polymer layer, but it also enables analysis of dynamic behavior such the transition between hydrated and dehydrated states, i.e., water uptake and release, which are sensed as changes in mass, as illustrated in Fig 1.
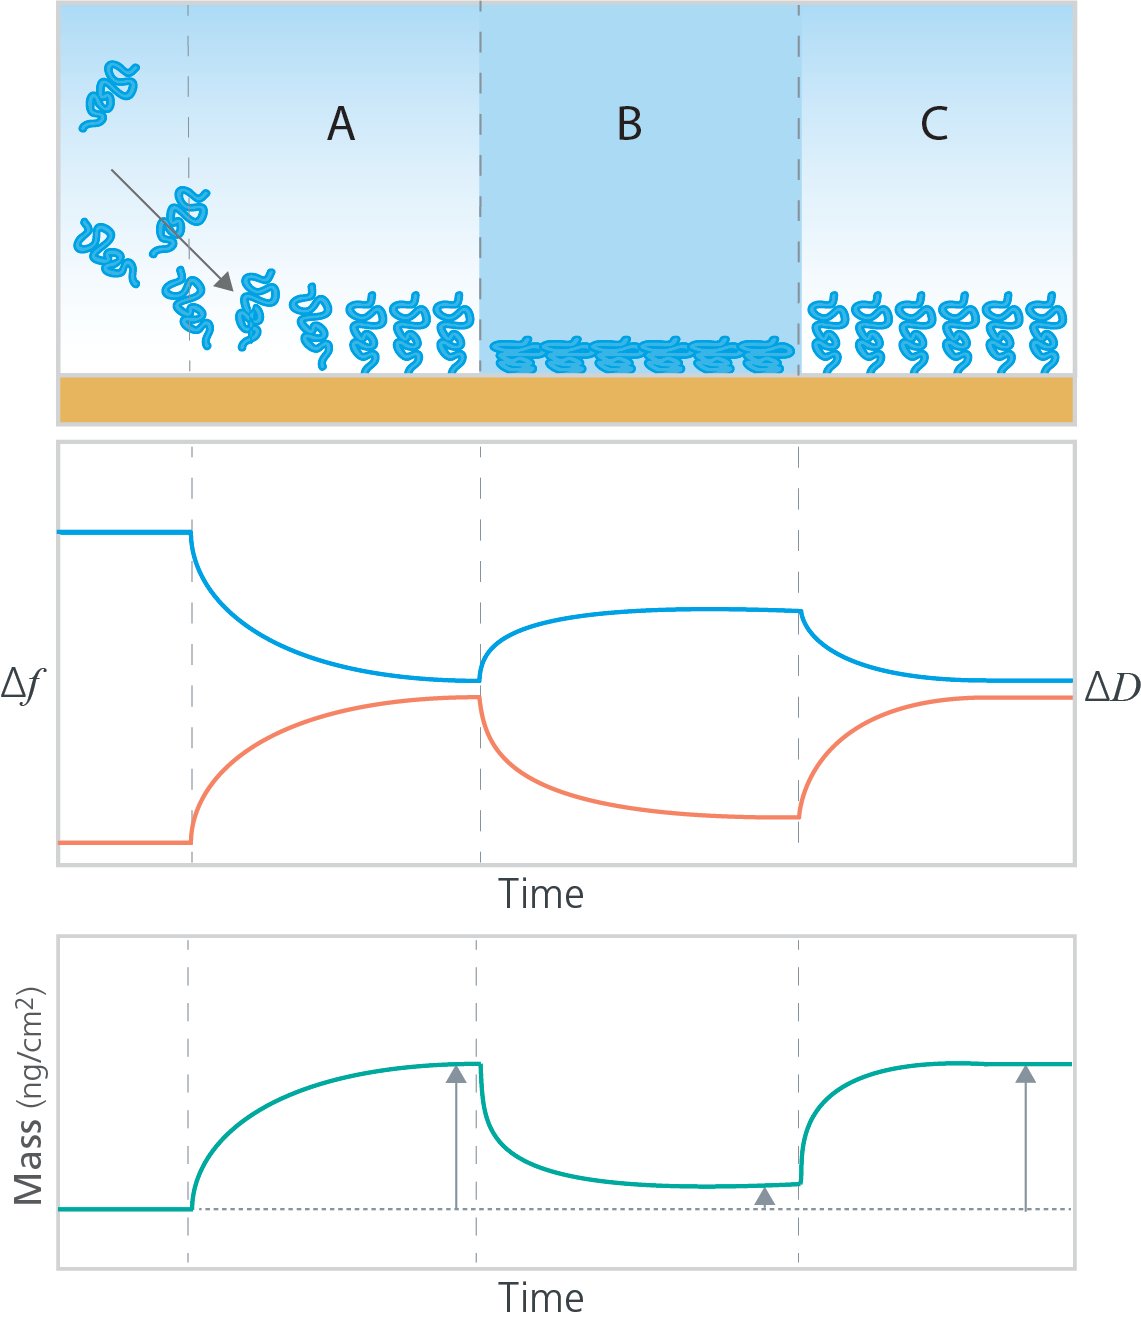
Figure 1. Top panel: Schematic illustration of A) polymer grafting to a surface followed by B) conformational change due to changes in external conditions, C) which is reversible when the conditions are changed back to the original setting. Middle panel: The layer grafting and conformational changes are characterized by QSense QCM-D, where Δf (blue) corresponds to mass changes at the surface and ΔD (red) corresponds to layer softness. Bottom: The quantified mass as a function of time.
Running QCM-D analysis at different conditions of interest, varying for example surface (substrate) material, temperature, pH, salt concentration or salt type, the properties and dynamic behavior of the polymer-based system can be characterized as well as tailored for the target application.
Polymer layer properties and dynamic behavior that can be analyzed includes:As stated in the review by Easley et al.1, the use of QCM-D to examine real-time responses of thin polymer films is rapidly expanding. QCM-D senses hydrated mass, i.e., the mass of both the polymer molecules and the coupled solvent, which makes it particularly suitable for analysis of dynamic behavior such the transition between hydrated and dehydrated states, i.e. water uptake and release, which are sensed as changes in mass
QSense QCM-D is for example used to:
Download the overview to read more about how thin polymer films can be characterized using QSense QCM-D technology.


Malin graduated in engineering physics in 2006, where her research focused on the QCM-D technology. Since then, she has been scrutinizing the how’s and why’s of the world in general, and the world of QCM-D in particular.