If you have used QCM-D, you have most surely heard of the so-called “bulk shift” or “buffer effect”. Here we explain what this shift is, why it arises and how you could plan your QCM-D experiments to avoid, or account for them.
The QCM-D technique is sensitive to any change in the medium above the sensor surface. For a purely viscous bulk liquid, f and D depend on the density and shear viscosity of the liquid according to eq. 1 and eq. 2,
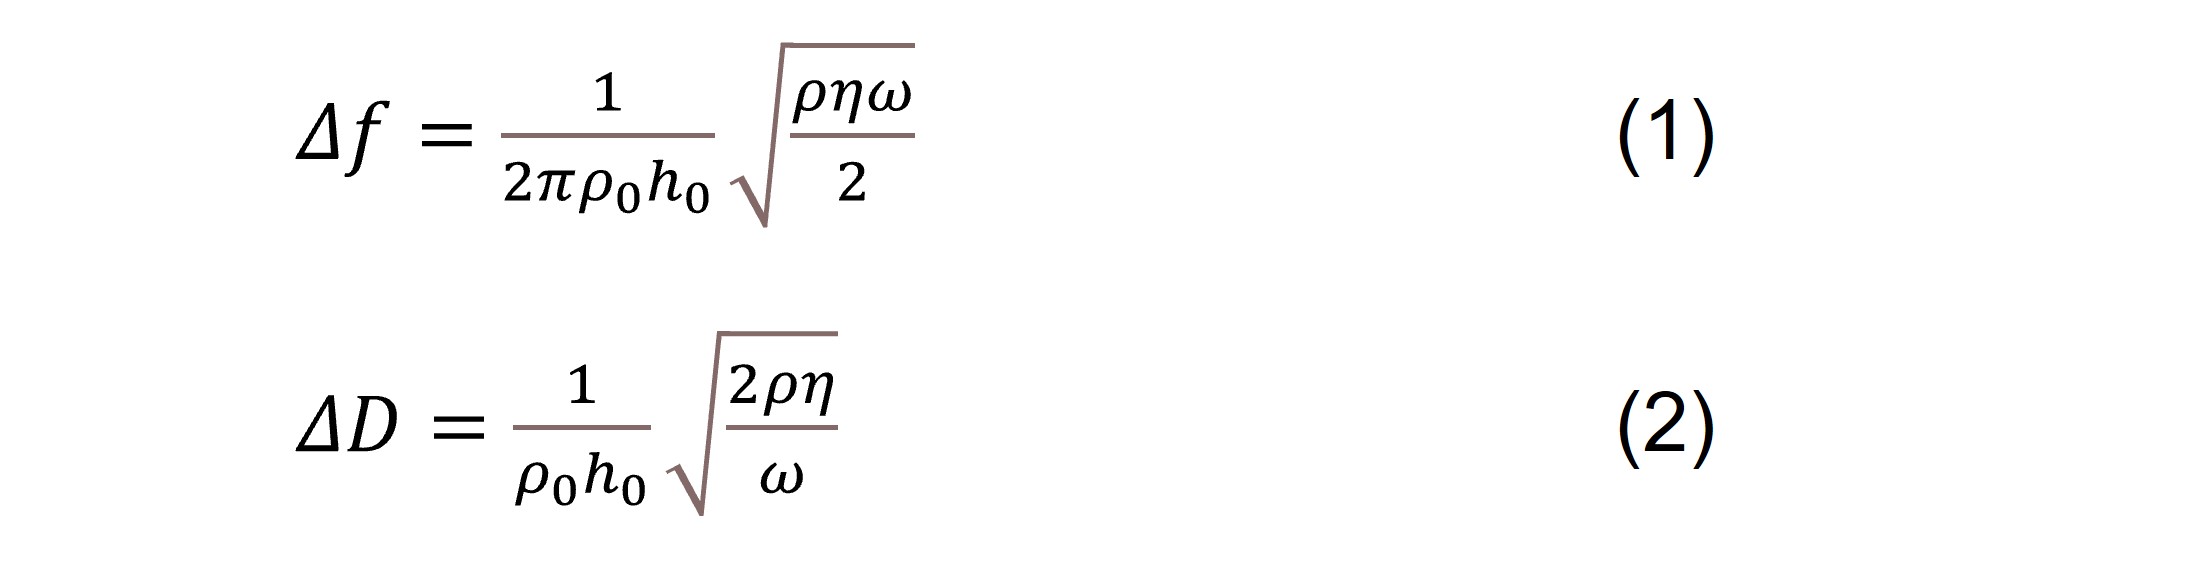
where η and ρ are the viscosity and density of the liquid, and h0 and ρ0 are the thickness and density of the quartz plate respectively, ρ0 being 2.648 g/cm3. This means that a shift from one medium to another, for example from air to solvent, from one buffer to another, or from solvent to sample, will result in shifts in f and D, so called bulk shifts.
All factors that affect the medium density and/or viscosity will have an impact on the QCM-D baseline. I.e., if you change from a solvent with certain properties to another solvent with slightly different properties, there will be a step-like behavior in the signals. Factors such as salt concentration and pH will affect the solvent properties, which means that if you use buffers with different salt concentrations or different pH, you may observe bulk shifts. The effect can also appear if high concentrations of analytes, such as proteins, are used.
In contrast to most adsorption processes, a bulk shift will be instantaneous in both f and D. Typically, it shows up like a change of the f and D baselines, and this shift is reversible, and surface independent.
There are a few ways to eliminate or at least minimize bulk shifts. In cases where they are not possible to avoid completely, there are ways to account for them.
The so-called bulk shift is an immediate, and reversible shift of the QCM-D baseline reflecting changes of the bulk properties as one medium above the sensor is replaced for another one. A typical example would be when going from one buffer to another. In general, bulk shifts are more or less unavoidable, but their occurrence can be minimized, and their impact accounted for, if the experiments are carefully planned and executed.
Download the overview to learn more about the bulk shift and how to account for it.


Malin graduated in engineering physics in 2006, where her research focused on the QCM-D technology. Since then, she has been scrutinizing the how’s and why’s of the world in general, and the world of QCM-D in particular.