QSense QCM-D technology enables real-time monitoring of vesicle interaction with solid substrates. Here we describe what information QCM-D measurements reveal, and how this analysis is typically used in the context of vesicle-surface interaction.
In 1998,1 Keller and Kasemo showed that adsorption of intact vesicles to solid substrates is easily identified by QCM-D measurements. The vesicle adsorption fingerprint, which is schematically illustrated Fig 1, shows a characteristic signature in f and D. The large shifts in both f and D indicate that there is a large mass uptake and that the formed layer is very soft, as is the case of an adlayer constituted by vesicles.
As described for example in this post, QCM-D measures what is often referred to as “hydrated mass”, i.e., the mass of not only the molecules interaction with the QCM sensor surface, but also the mass of the associated solvent. This makes the technology particularly suitable to unveil structure and structural changes, such as vesicle rupture. So QCM-D measurements can readily reveal the vesicle-surface interaction dynamics, if the vesicles adsorb intact, and if they stay intact over time or if they rupture, for example when the ambient change or if they are exposed to disruptive components.
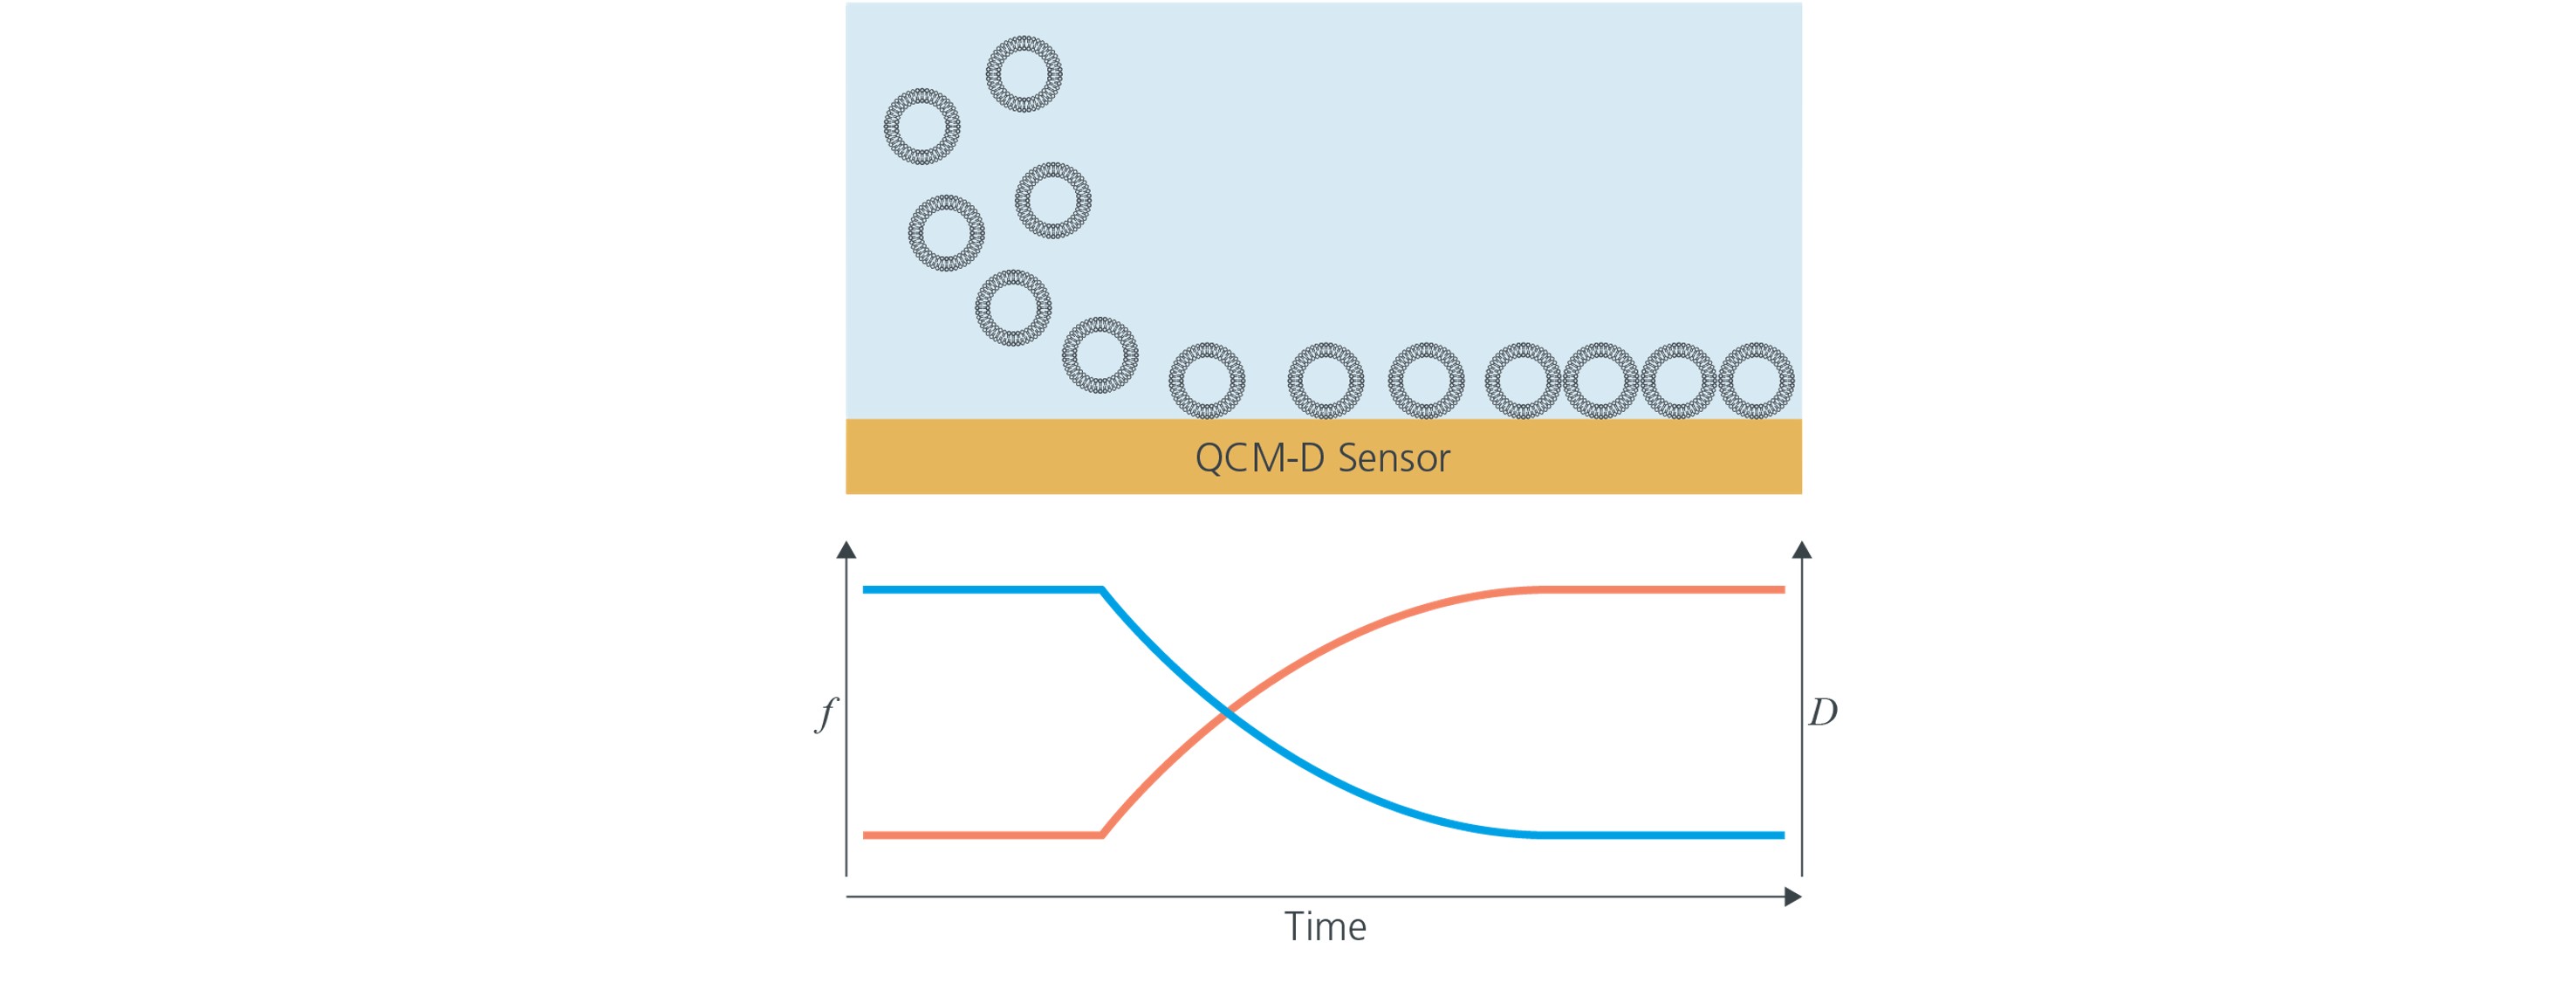
Figure 1. Schematic illustrations (not to scale) of adsorption of intact vesicles to a solid support as monitored by QSense QCM-D. When the vesicles adsorb, the frequency (blue), decreases, which indicates that the mass at the surface increases. At the same time, the dissipation (red) increases, which indicates that a thick and soft layer is forming at the surface.
Vesicle-surface interaction and surface-adsorbed vesicle platforms are typically analyzed in situations where complex lipid mixtures are of interest, if the vesicles are functionalized with e.g., proteins or if specific surface material of the solid support are explored. QCM-D is for example used to (Fig. 2)
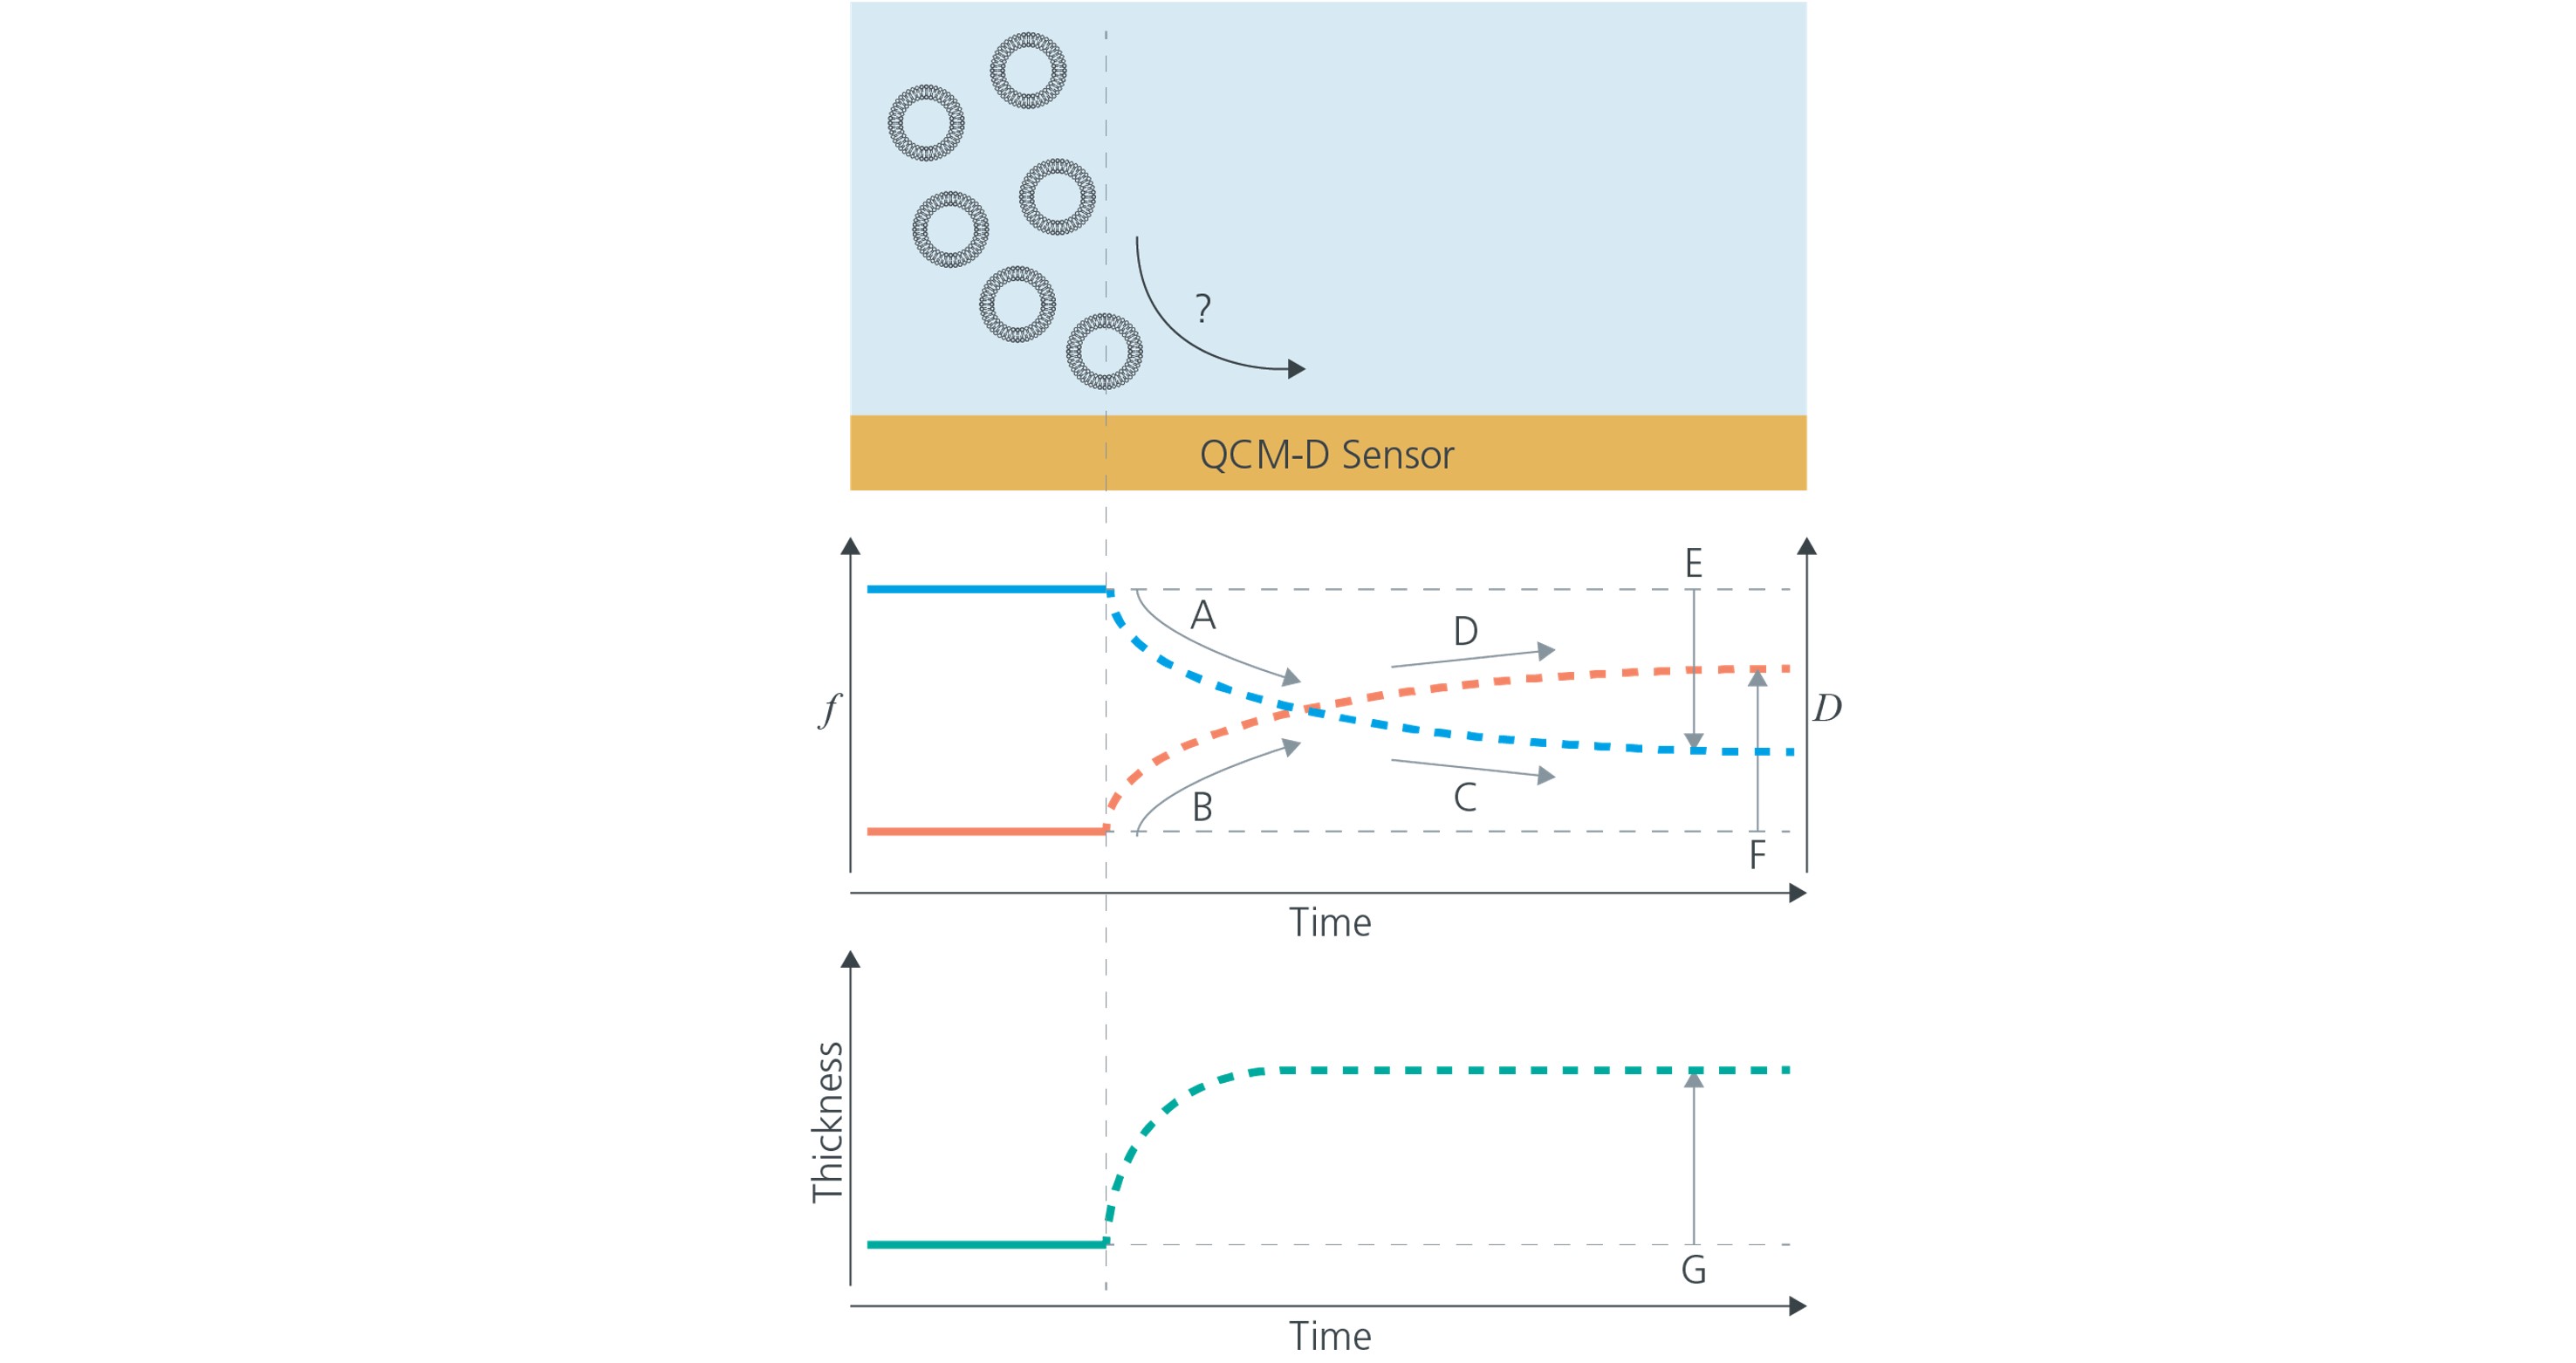
Figure 2. Using QCM-D, questions related to the vesicle adsorption dynamics and the vesicle layer properties can be answered, e.g. are the vesicles adsorbing (A, B)? What does the adsorption dynamics look like (A- D)? Will the vesicles stay intact over time (E, F)? And what is the thickness of the vesicle layer (G)?
For example, Cho et al2 used QSense QCM-D as one of the tools to explore if a peptide with membrane disruptive properties could be used to force rupture of surface adsorbed vesicles. The goal was to develop an easy and straightforward method to create high quality lipid bilayer on surfaces such as Au and TiO2, where lipid bilayer formation traditionally was problematic. The characteristic QCM-D signature revealed both the expected adsorption of intact vesicles to the Au and TiO2 surfaces, as well as the interaction of the peptide with the surface-adsorbed vesicles followed by vesicle rupture and fusion. The study proved that high quality lipid bilayers indeed could be created on both surfaces using the so-called AH-peptide.
In another study, Jackman et al,3 used the same experimental layout of surface adsorbed vesicles and AH peptide, the peptide with membrane disruptive properties. In this study, the surface adsorbed vesicle platform was used as a viral membrane mimicking model system, to analyze the influence of vesicle size on the peptide – vesicle interaction and vesicle rupture. The study concluded that there is a size dependence on the peptide-induced vesicle rupture.
As demonstrated in the nice study by Keller and Kasemo in 19981, QCM-D is a powerful tool to explore and characterize lipid – based systems such as vesicle surface interaction dynamics and the properties of surface adsorbed vesicles. The technology is typically used to answer questions related to the how’s and the why’s of vesicle-surface interaction. An example of ongoing work is where QSense QCM-D is used in combination with surface-adsorbed vesicles as a viral-membrane mimic, to explore new antiviral strategies.3, 4
Download the overview to learn more about QSense analysis of lipid-based systems

Malin graduated in engineering physics in 2006, where her research focused on the QCM-D technology. Since then, she has been scrutinizing the how’s and why’s of the world in general, and the world of QCM-D in particular.