You have spent hours in the lab, planning, preparing and running experiments. And still, you are only half-way to the answer. The data analysis remains. Depending on what kind of information you would like to extract, analyzing the data can take as much time, or even more, than doing the actual measurements. Using the right tools, and knowing how to use them, can save you lots of valuable time.
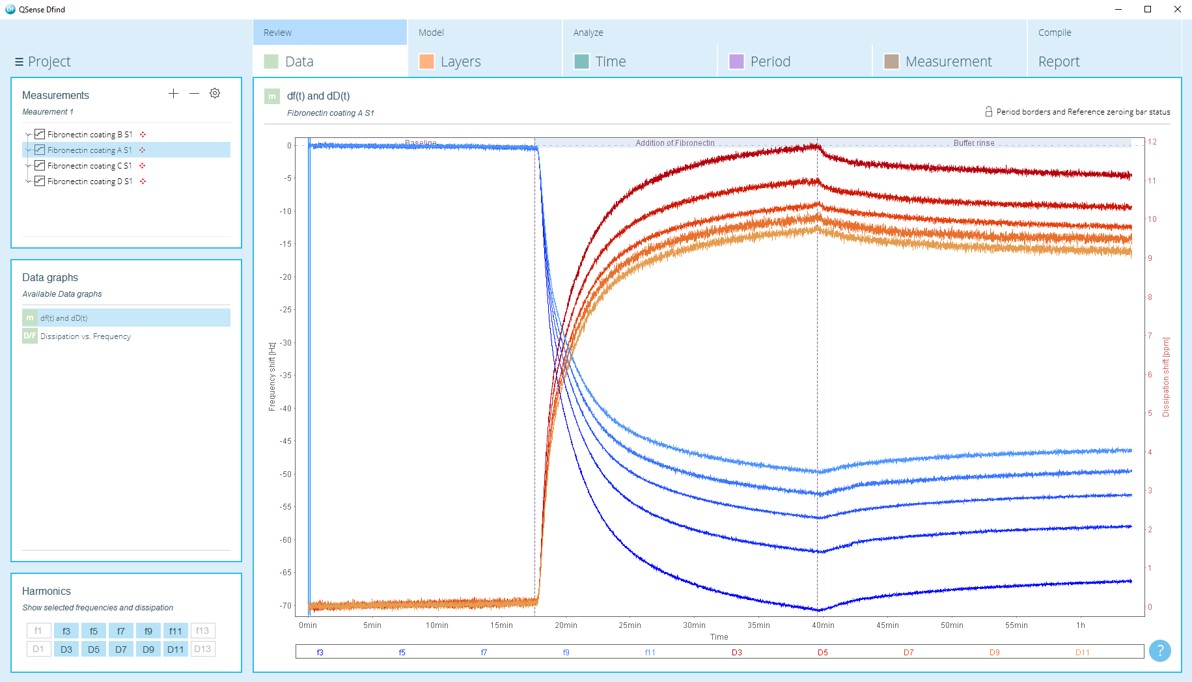
QSense data analysis software is called QSense Dfind. This is a graphical software that automatically plots QCM-D data and allows you to quickly get an overview of what the different data sets look like and to compare them with each other.
In addition to the automatic plotting, there are other features that will save you time. For example:
QSense Dfind allows you execute all the data treatments steps, from looking at the raw data and comparing the results, to modeling and extracting key information such as Δf and ΔD shifts, to compile the results in a report.
 So how does it work? In brief, a handful of steps will take you through the basic data analysis:
Of course, additional steps can be executed for more complex analysis
Learn more by watching the webinar where Jennie walks you through the different features and functions of QSense Dfind, and shows you how to analyze different types of QCM-D data using this software.

Malin graduated in engineering physics in 2006, where her research focused on the QCM-D technology. Since then, she has been scrutinizing the how’s and why’s of the world in general, and the world of QCM-D in particular.