If you are using QCM analysis in your work, you may have encountered two common approaches to quantify the surface-bound mass, using either the Sauerbrey equation or viscoelastic modelling. As you may be aware, the respective method should be used at specific conditions. In this post, we explain when viscoelastic modelling should be used.
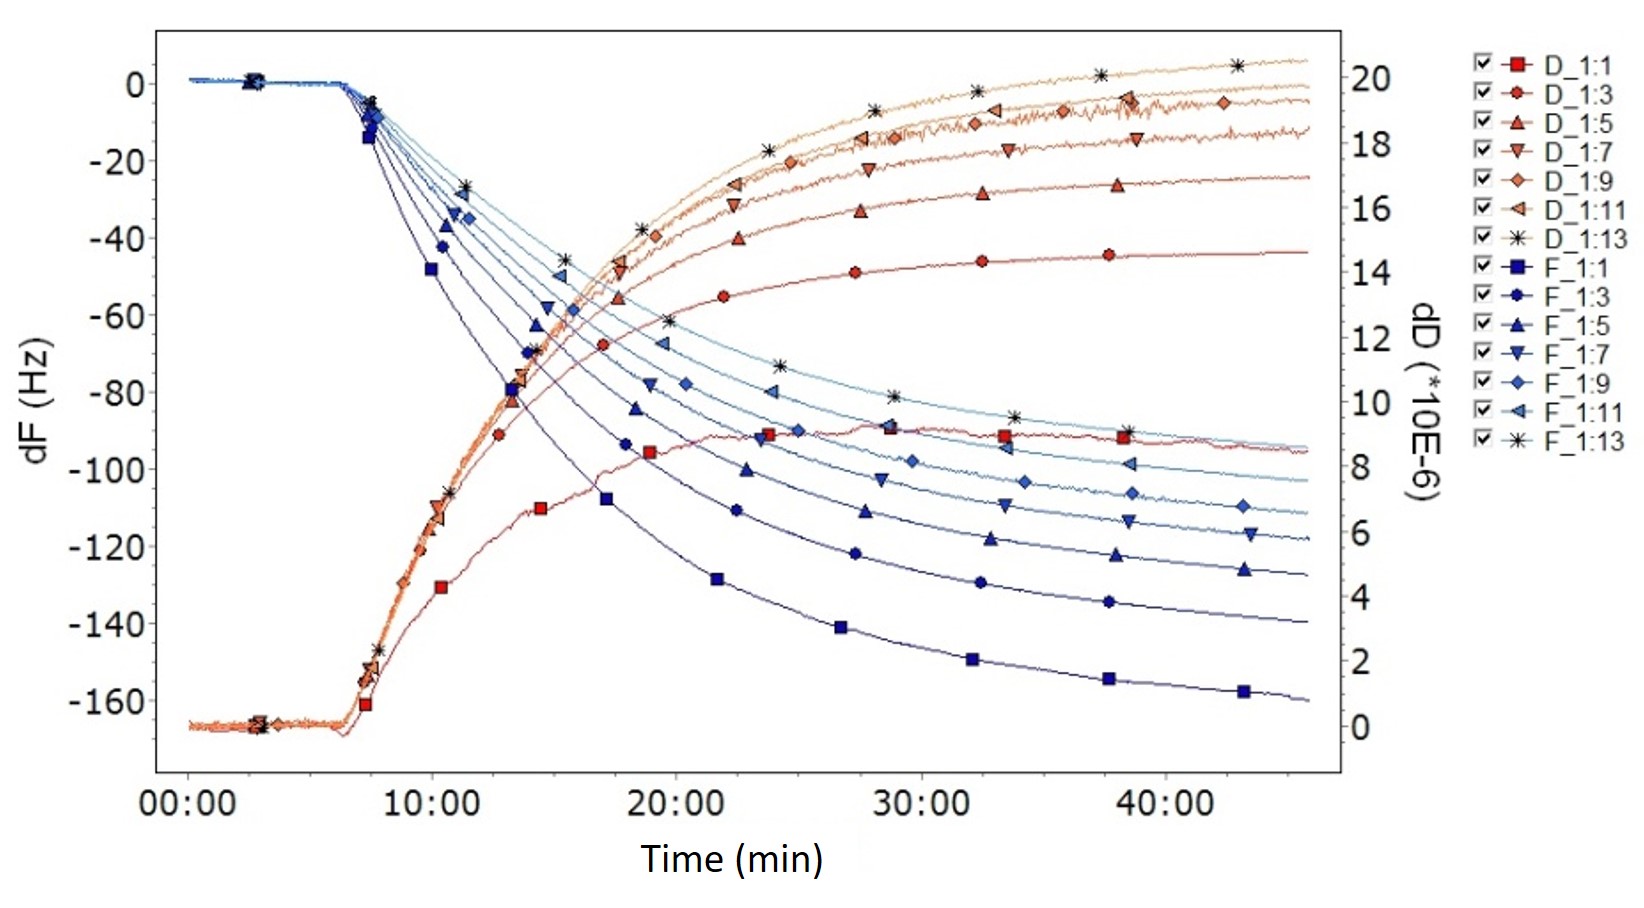
Let’s say you have run a set of successful QCM measurements and now you would like to analyze the data and extract the mass of the surface-adhering layer. If the layer to be analyzed is soft and fulfills the modeling requirements, viscoelastic modelling is what you should use. So, how do you know if the layer is soft? If you are using multi-harmonic QCM-D, the characteristics of the layer is straightforward to assess by looking at the raw data where the key signature of a soft layer is high energy loss, i.e., a dissipation shift ΔD larger than zero, and spreading harmonics, Fig. 1. In brief, and as a rule of thumb, viscoelastic modeling should be used if:
ΔD larger than zero means that the material in contact with the sensor surface is inducing energy losses. This happens when soft films, such as biomolecule- or polymer-based layers, are deposited. Spreading harmonics reveal that the layer properties influence the recorded signals, and each harmonic will provide unique information on these layer properties. For a more detailed description of the Voigt model and the equations implemented for viscoelastic analysis in QSense Dfind, we really recommend the interested reader to take a look at the publication by Voinova et al.1

Figure 1. Multiharmonic QCM-D data showing the characteristics of a viscoelastic layer- high dissipation and harmonics that spread.
Unlike the Sauerbrey equation, where only one single frequency is needed as input into the equation to calculate the mass, information from multiple harmonics is key to perform viscoelastic analysis.
The reason for this is that the viscoelastic model contains several unknown parameters which need to be fitted to data. And, to fit the unknown parameters, at least the same number of measured variables are needed to be fed into the model. Depending on whether a frequency independent or frequency dependent model is used, there are either three or five unknown parameters. If you are using a multi-harmonic QCM-D, each harmonic will provide two parameters, f and D, so for a frequency independent model, at least two harmonics need to be captured and for the frequency dependent model at least three harmonics need to be captured. Capturing f and D for three harmonics will give six measured variables which is theoretically enough to feed into the frequency dependent model. However, this is only enough if we can assume a perfect measurement and a perfect model. Since there is always noise in the data and reality rarely is perfectly described by a mathematical model, it is good to use as many input variables as can be measured. If you are using a multi-harmonic QCM-D, we therefore recommend that you capture f and D at as many harmonics as you can.
If you are running QCM analysis on soft films and would like to quantify the mass or thickness of these layers, viscoelastic modelling is the way to go. If you are using a multi-harmonic QCM, the raw data will reveal if the layer is soft or not, and key signatures to look for are
I.e., if these conditions are fulfilled, and the modelling assumptions apply, you could use viscoelastic modelling to quantify the layer mass. Please note that when modelling, it is important to keep in mind that when you fit a model to measured data, the values obtained must be interpreted in the context of the model. I.e., if the model does not accurately describe your experimental system, then the conclusions drawn from the modelled results may not be correct.
Download the guide below to learn more about when to use viscoelastic modelling and what will be the consequences if you instead use the Sauerbrey equation to analyze soft layers.
Learn how QSense QCM D can be used to analyze swelling of thin films, including magnitude and dynamics.
Read about how molecule-surface interaction processes such as adsorption and desorption can be analyzed with QCM-D.
Learn best practices and step-by-step methods for accurate QCM-D coating thickness measurement on QSense sensors using QSense Omni.
Compared to QCM, QCM-D measures an additional parameter, and provides more information about the system under study.
Discover how QCM-D analysis reveals real-time etching dynamics, helping optimize cleaning processes and protect surfaces from unwanted damage.
Discover how QSense QCM-D helps tackle fouling challenges across industries
Discover how QCM-D enables real-time, label-free analysis of supported lipid membrane formation, structure, and dynamics for advanced research
Learn how QSense QCM-D analysis can reveal membrane fouling dynamics and optimize cleaning strategies for more efficient water treatment
Learn how QSense QCM-D helps detect and prevent surface-induced instabilities in biologics. Join our webinar for insights and practical examples.
