
Quantifying QCM mass, there are two different approaches to choose from depending on whether the layer is rigid of soft - the Sauerbrey equation or viscoelastic modeling. But what if the wrong model is applied, what happens then? How critical are the consequences? Here we describe what happens if the wrong quantification approach is used.
Comparing the two situations of using Sauerbrey on a viscoelastic layer and using viscoelastic modelling on a rigid layer, the first one is the most severe. Since the Sauerbrey equation is not valid for viscoelastic layers, the calculated mass using this approach will be incorrect. Not only will the mass be underestimated, but the result will also vary depending on which harmonic that was used for the calculation. An example of this situation is illustrated in Fig. 1, where the results from Sauerbrey quantification and viscoelastic modeling of a soft layer are compared. As shown in the figure, the calculated Sauerbrey mass depends on which of the harmonics that was used as input. A key signature of a soft layer is that the harmonics are spreading, and the Sauerbrey mass will, therefore, depend on which harmonic that was used for the calculation.
As can also be observed in Fig. 1, none of the mass curves where Sauerbrey was used are close to the viscoelastic modeled one; they all underestimate the mass. This means that for soft layers, the Sauerbrey approach cannot even be used to get an estimation of the mass.
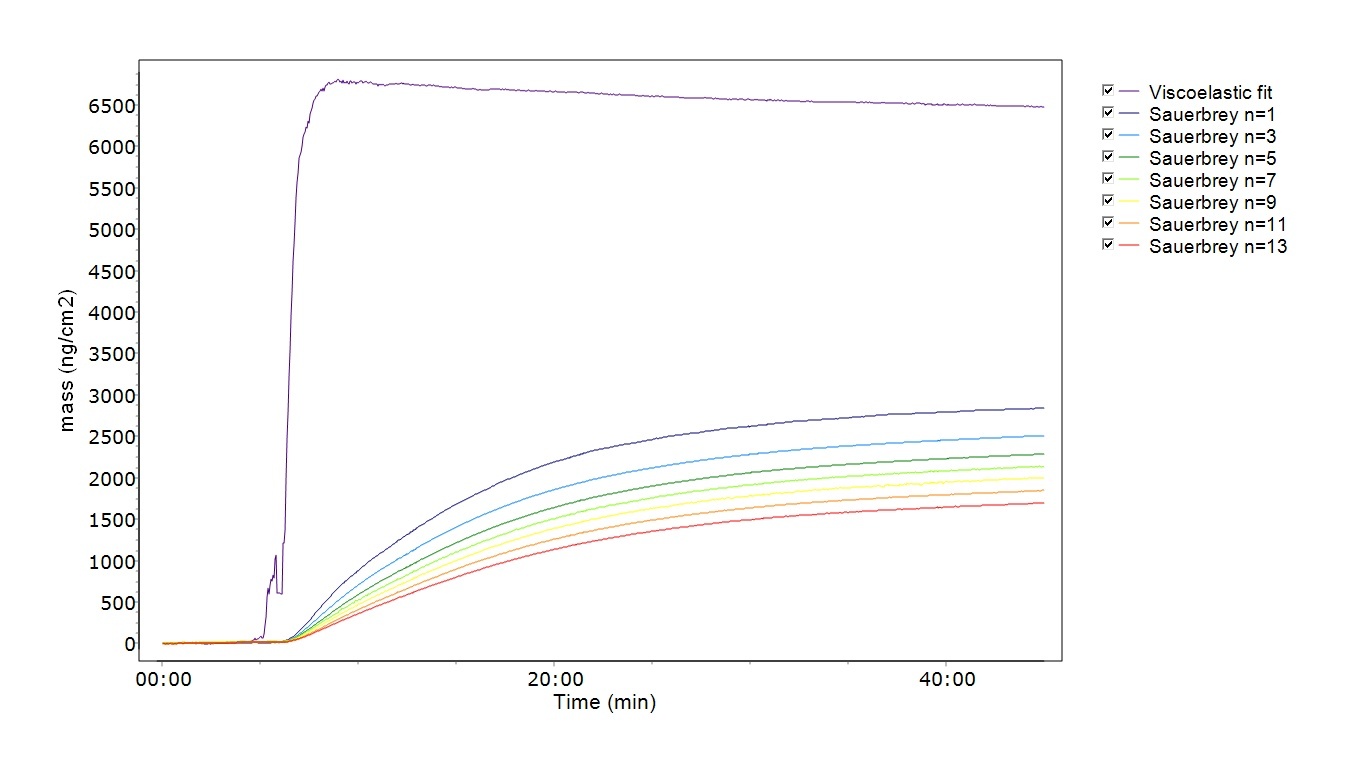
Figure 1. Mass calculated for a viscoelastic layer, comparing the results from Sauerbrey calculations using QCM-D harmonics n = 1 - 13 and viscoelastic modeling.
Using viscoelastic modeling on a rigid layer is less severe than the other way around. In this situation, the biggest problem will be for the modeling software to find a good fit to the data. To model the QCM-D data, unique input from at least two harmonics is needed, and since the overtones are overlapping for rigid films, the different harmonics will not provide enough unique information to use as input in the model. The consequence of this approach can sometimes, therefore, be that the software will not succeed in finding a solution. If it does, the modelled viscosity and shear values may be random.
If the layer to be analyzed fulfills the QCM_D modeling requirements, there are two approaches that can be used depending on whether the layer is rigid or soft, namely the Sauerbrey equation or viscoelastic modelling. Applying the rigid layer approach on a soft layer will give the wrong result and is more severe than the other way around where the main consequence is that it can be difficult to find a good fit.
Download the guide to learn more and to get a summary on how to assess which analysis method to use to quantify your QCM-D data.


Malin graduated in engineering physics in 2006, where her research focused on the QCM-D technology. Since then, she has been scrutinizing the how’s and why’s of the world in general, and the world of QCM-D in particular.
