If you are using QCM-D, you are probably aware that to quantify the data, the deposited layer at the surface should be evenly distributed. But why is this important? Here we describe what the mass sensitivity distribution looks like, and why it looks the way it does.
The QCM sensing principle is based on motion. The sensor surface oscillates back and forth, and if mass couples to this oscillatory motion, it will be sensed. The sensing area, i.e., the area that vibrates is called the active area, and is mainly confined to the overlap of the QCM electrodes.
The amplitude of the crystal vibration is, however not constant over the crystal surface but it varies in a fashion determined by geometry of the sensor and the sensor electrodes. In standard QCMs, disk-like sensors and circular electrode are typically used, Fig 1. On such sensors, there is, to a good approximation, a radial dependence of the oscillation amplitude, A(r), according to Eq. 1.

The maximum amplitude, A0, is reached in the middle of the sensor, at r = 0, and then it tapers off towards the sensor edge. The width, c, of this gaussian distribution depends on the harmonic, the higher the harmonic, the sharper the gaussian, Fig 1. 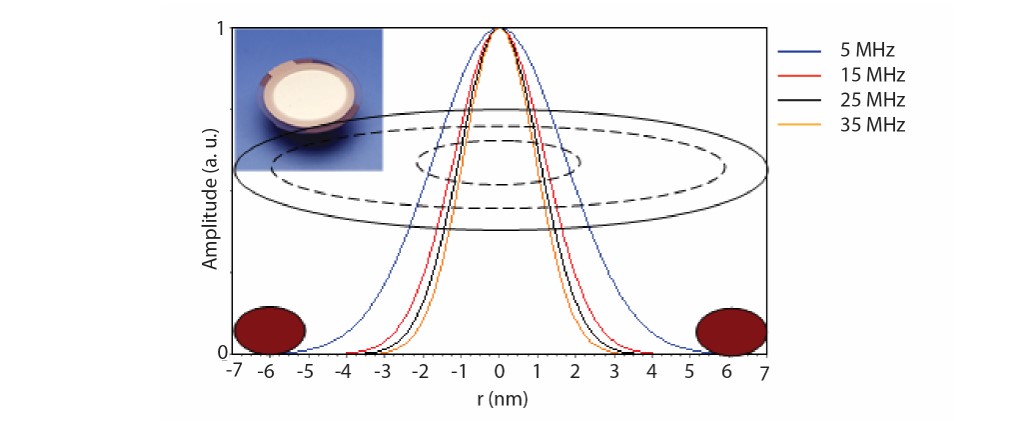
Figure 1. Normalized distribution of the crystal oscillation amplitude of harmonics n = 1, 3, 5 and 7 for a 5 MHz crystal [1]. The width of the gaussian depends on the harmonic, the higher the harmonic the sharper the Gaussian. The large and small dashed circles represent the top and bottom QCM electrodes respectively. The brown ellipses represent cross-sections of the top O-ring.
As already stated, mass that couples to the oscillatory motion of the QCM crystal will be sensed. The force exerted on a particle sitting at the sensor surface is proportional to the oscillation amplitude at that point, and Sauerbrey showed that the differential mass sensitivity, S(r,ϴ), at a distance r from the center of the crystal and at an angle ϴ in the crystal plane, will be proportional to the amplitude. The differential mass sensitivity, which is defined as

represents the differential frequency change per mass change at a specific location on the sensor surface. Integrating over the entire active area gives the integral sensitivity Cf

The measured frequency shift, Δf, for mass deposited at the QCM sensor surface will then be

where m(r,ϴ) is the mass distribution.
As discussed above, the frequency shift caused by a localized mass, for example a particle, deposited at the QCM sensor surface depends on the oscillation amplitude at that point. Each localized mass at the surface will contribute to the overall observed frequency shift, and the frequency shift that is recorded, is the sum of all local contributions from the entire sensor surface.
If m(r,ϴ) is uniform, Δf will be linelarly dependent on the layer thickness. In this case, the mass sensitivity, S(r ϴ) is unimportant, and the Sauerbrey equation, eq. 5, which assumes that the added mass is uniformly distributed over the crystal surface, can be used. 
If m(r,ϴ) is not uniform, however, the Sauerbrey equation will not generate a correct estimation of the deposited mass.
The QCM mass sensitivity function is related to the oscillation amplitude of the crystal, and this typically has a gaussian distribution. The width of this gaussian depends on the harmonic, the higher the harmonic, the narrower the gaussian. The gaussian shape of the mass sensitivity function means that the frequency response of a localized mass depends on the position where it is placed. The closer to the center, the larger the contribution to the observed frequency shift. The frequency shift that is recorded in a QCM measurement is the sum of all local mass contributions from the entire sensor surface. This is also why a uniformly distributed layer at the sensor surface is important.
Download the overview to learn more about the mass sensitivity function and how an unevenly deposited mass will impact the quantification.

Malin graduated in engineering physics in 2006, where her research focused on the QCM-D technology. Since then, she has been scrutinizing the how’s and why’s of the world in general, and the world of QCM-D in particular.