Polyelectrolyte multilayers (PEMs) are created by layer‑by‑layer deposition of oppositely charged polymers onto a surface. Quartz crystal microbalance with dissipation monitoring, QCM‑D, has been used to characterize polymer‑based systems, including PEMs, for more than two decades. With QSense QCM‑D you can follow PEM build‑up in real time by tracking changes in resonance frequency, Δf, and dissipation, ΔD, revealing how much material is added in each step and how the multilayer structure evolves.
Polyelectrolyte multilayers were introduced by G. Decher and co‑workers in the early 1990s and have since attracted extensive interest because of their advantages in a wide range of applications. With each adsorption step in the layer‑by‑layer build-up process, a new polymer layer is added and the film grows in thickness, often becoming more hydrated and softer.
PEMs are particularly interesting to characterize with QSense QCM‑D, a surface sensitive real‑time technology sensitive to mass changes down to the ng/cm² level. In addition to mass changes, the dissipation response provides information about the viscoelastic properties of the surface adhering layer and about structural changes induced by, for example, crosslinking reactions or changes in environmental conditions.
By tracking changes in Δf and ΔD, QSense QCM‑D reveals how much material is added in each step, how the mechanical properties of the PEM evolve, and how the overall growth mode depends on conditions such as pH, salt concentration, and polyelectrolyte structure. This makes it a powerful tool for understanding and optimizing PEM build‑up for different applications.
A schematic example of what PEM build‑up can look like in QCM‑D data is shown in Fig. 1. The multilayer growth is reflected by changes in Δf and ΔD, which can then be used to quantify layer thickness as well as the mechanical properties of the film (not shown). By following how these parameters evolve over successive deposition steps, the growth mode and thickness increase throughout the build‑up process can be assessed, for example to determine whether the growth is linear or exponential.
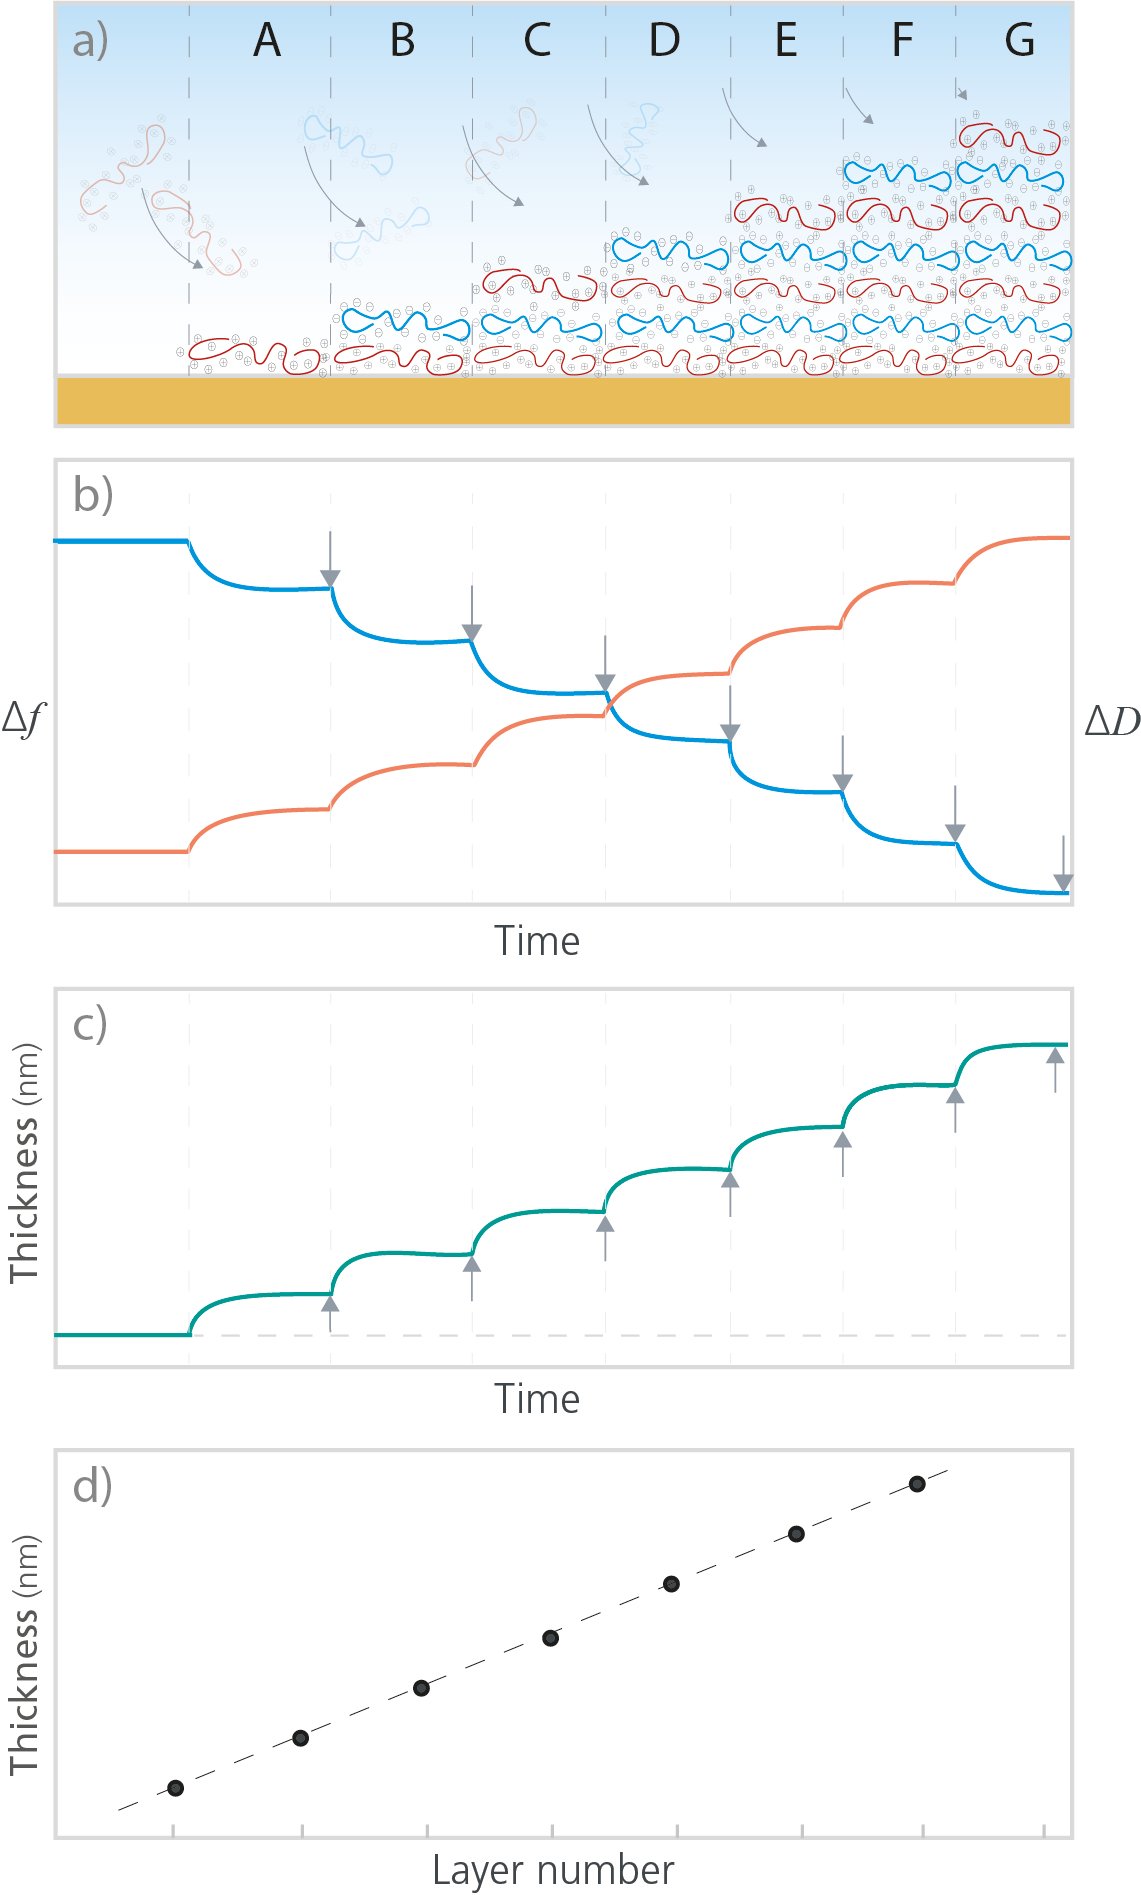
Figure 1. a) Schematic illustration of a PEM build-up process, where a layer is added in each step A-G. b) The PEM build-up is characterized by QSense QCM-D, where Δf (blue) corresponds to mass changes at the surface and ΔD (red) corresponds to layer softness. As indicated by the grey arrows, the time-resolved data makes it possible to follow the adsorption/binding process, how fast it is, and how much material that is added to the surface. The data shows that for each layer, there is mass added (decrease in Δf) and the layer gets softer/thicker (increase in ΔD). c) The quantified thickness of the PEM as a function of time. d) The thickness plotted as a function of layer number shows that the growth process is linear.
The PEM build-up and layer structure depend on several factors, and running QCM-D analysis at relevant conditions can provide insight into how the growth is influenced by variations in, for example, the polyelectrolyte structure and the external conditions such as pH, temperature, and salt concentration. By systematically varying these parameters and monitoring the QCM‑D response, you can observe, for example:
This type of analysis helps you understand and control PEM build‑up for specific applications, from coatings and membranes to biointerfaces and drug delivery systems.
A standard QSense QCM-D PEM experiment often follows this sequence:
PEMs are used in many research and application areas, and understanding their build‑up and structure is crucial for performance:
In all these cases, QSense QCM-D helps connect experimental conditions such as pH, salt, and polyelectrolyte type, to multilayer structure and behaviour (growth mode, swelling, softness, stability).
QSense QCM-D is a surface sensitive technology that is used to monitor PEM growth as well as the mechanical properties of the resulting layer as a function of measurement conditions. By following changes in Δf and ΔD in real time, you can:
Download the overview to learn more about QSense analysis of polymer-based systems and what information QSense QCM‑D can provide on PEMs and other multilayer films.

Malin graduated in engineering physics in 2006, where her research focused on the QCM-D technology. Since then, she has been scrutinizing the how’s and why’s of the world in general, and the world of QCM-D in particular.