Proteins tend to passively adsorb to surfaces via hydrophobic interactions. The amount adsorbed depends on many factors such as the protein itself, the ambient conditions, and the surface material. So how can we assess the adsorbed amount at these various conditions? Here we show how protein adsorption can be quickly measured.
To assess the adsorbed amount, we use QSense® QCM-D, a surface-sensitive real-time technology, that monitors mass changes at the surface. Monitoring mass changes as a function of time, it is straightforward to measure how much protein that adsorbs to the surface. It is also possible to compare the uptake at different conditions by varying, for example, the surface material, the protein concentration, buffer pH and ionic strength.
The surface material has a large impact on the amount of protein that will adsorb. Particularly interesting are plastic and glass materials, which are continuously used in protein biotechnology applications. For example, syringes, concentrator filters, and container systems are all composed of either glass or some plastic polymer. So, what are the adsorbed amounts of our model protein on for example borosilicate and PVDF surfaces?
Another parameter that may influence the adsorbed amount is the protein concentration. Such influence would be relevant in for example large-scale recombinant protein production, where extremely high protein concentrations are normally used. So, would there be any difference in surface uptake at different concentrations with our model protein at the two different surfaces?
Using QSense QCM-D, we addressed these questions and characterized the adsorption of lysozyme to saturation to borosilicate and PVDF, i.e. glass and plastic, at low and high protein concentrations (low, 1 mg/ml, and high, 40 mg/ml).
The results in Fig. 1 show that the surface uptake is 2.5 times higher for the glass surface compared to the plastic surface. It also shows that the adsorbed amount is more than double at the high protein concentration compared to the low one.
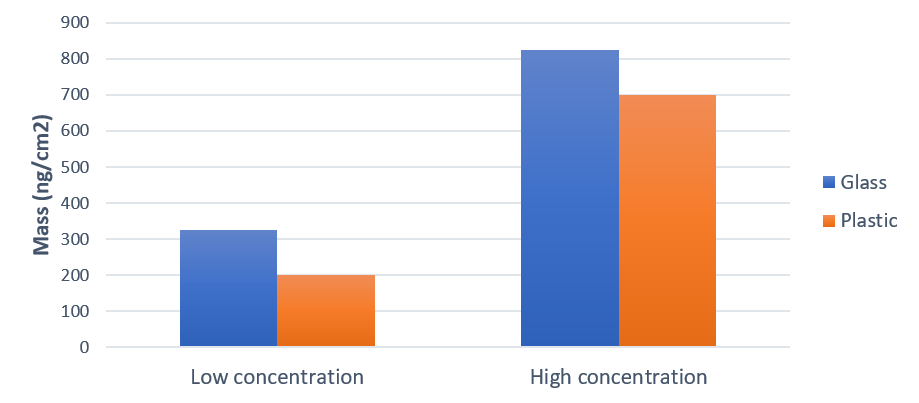
Figure 1. Protein adsorption, characterized as mass uptake, onto glass and plastics at two different concentrations. The surface uptake was higher with the high protein concentration. For both concentrations, more protein was adsorbed on the glass than on the plastic.
The amount of protein adsorbed to a solid surface will depend on many factors and are generally difficult to measure and quantify. However, using a real-time screening method such as QCM-D, conditions leading to protein losses can be minimized for many of the steps included in for example a protein production process.
Download the application note below to read the full study

Kenneth is a Director of Application & Development and Technology Transfer at Biolin Scientific