In a QCM-D measurement in liquid, introduction of a sample can lead to changes of f and D signals, either by a change in mass on the surface due to molecule-surface interaction, or by the change in the liquids own mass and viscous damping. So how can you tell if the shifts that you are observing are due to adsorption or if it is a mere liquid bulk shift taking place? Here we explain how you can tell one from the other and present a quantitative approach that will provide an additional clue to which phenomenon that you are observing.
QCM-D is sensitive to changes at and near the sensor surface, i.e., not only will it detect if molecules adsorb or desorb from the surface, but it will also detect changes in the medium above the sensor. Sometimes these two phenomena will co-exist.
Bulk shifts arise when there is a change in the density and/or viscosity of the medium, for example if you go from one buffer to another and the two buffers have different salt concentration. Such a change will result in a reversible change of the f and D baselines. There are two key characteristics of a bulk shift:
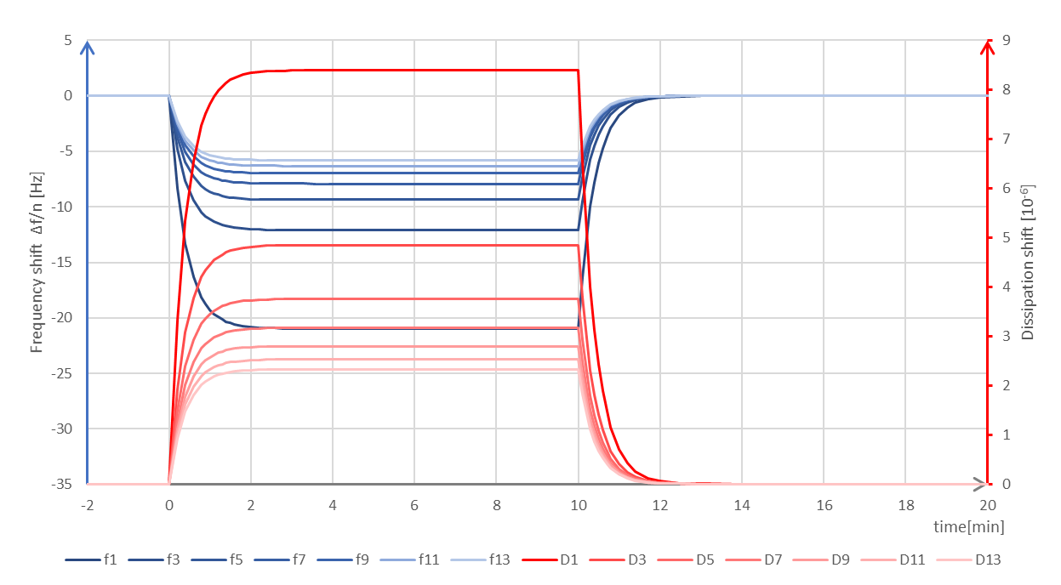
Figure 1. Schematic graph of QSense QCM-D data showing what a bulk shift could look like.
Adsorption and desorption of material from the sensor surface, are typically slower processes and not expected to result in symmetrical shifts in f and D in the same way as a bulk shift will. If molecules adsorb, the off-rate is often slower than the liquid exchange, Fig 2.
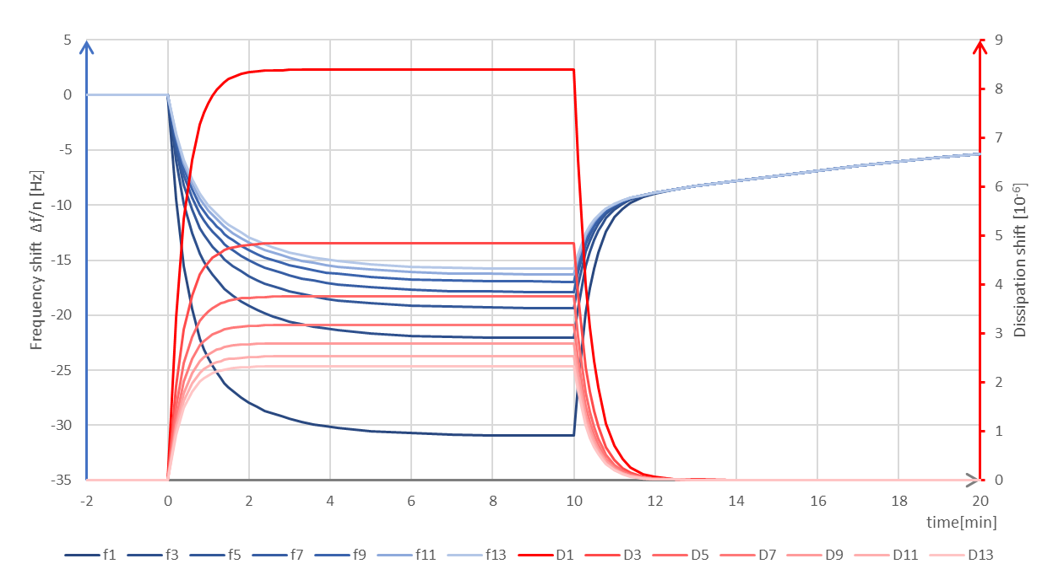
Figure 2. Schematic graph of QSense QCM-D data showing what a combined bulk shift + adsorption (thin and rigid layer) could look like. The initial sample introduction at 0 min time shows large shifts of the f and D baselines, and also the harmonics are spreading. The behavior is characteristic of a bulk shift, but it can also reflect mass uptake. At the rinse, 10 min, the frequency shift does not return to the baseline, but instead there is a slow desorption taking place. This behavior reveals that mass had adsorbed at the surface.
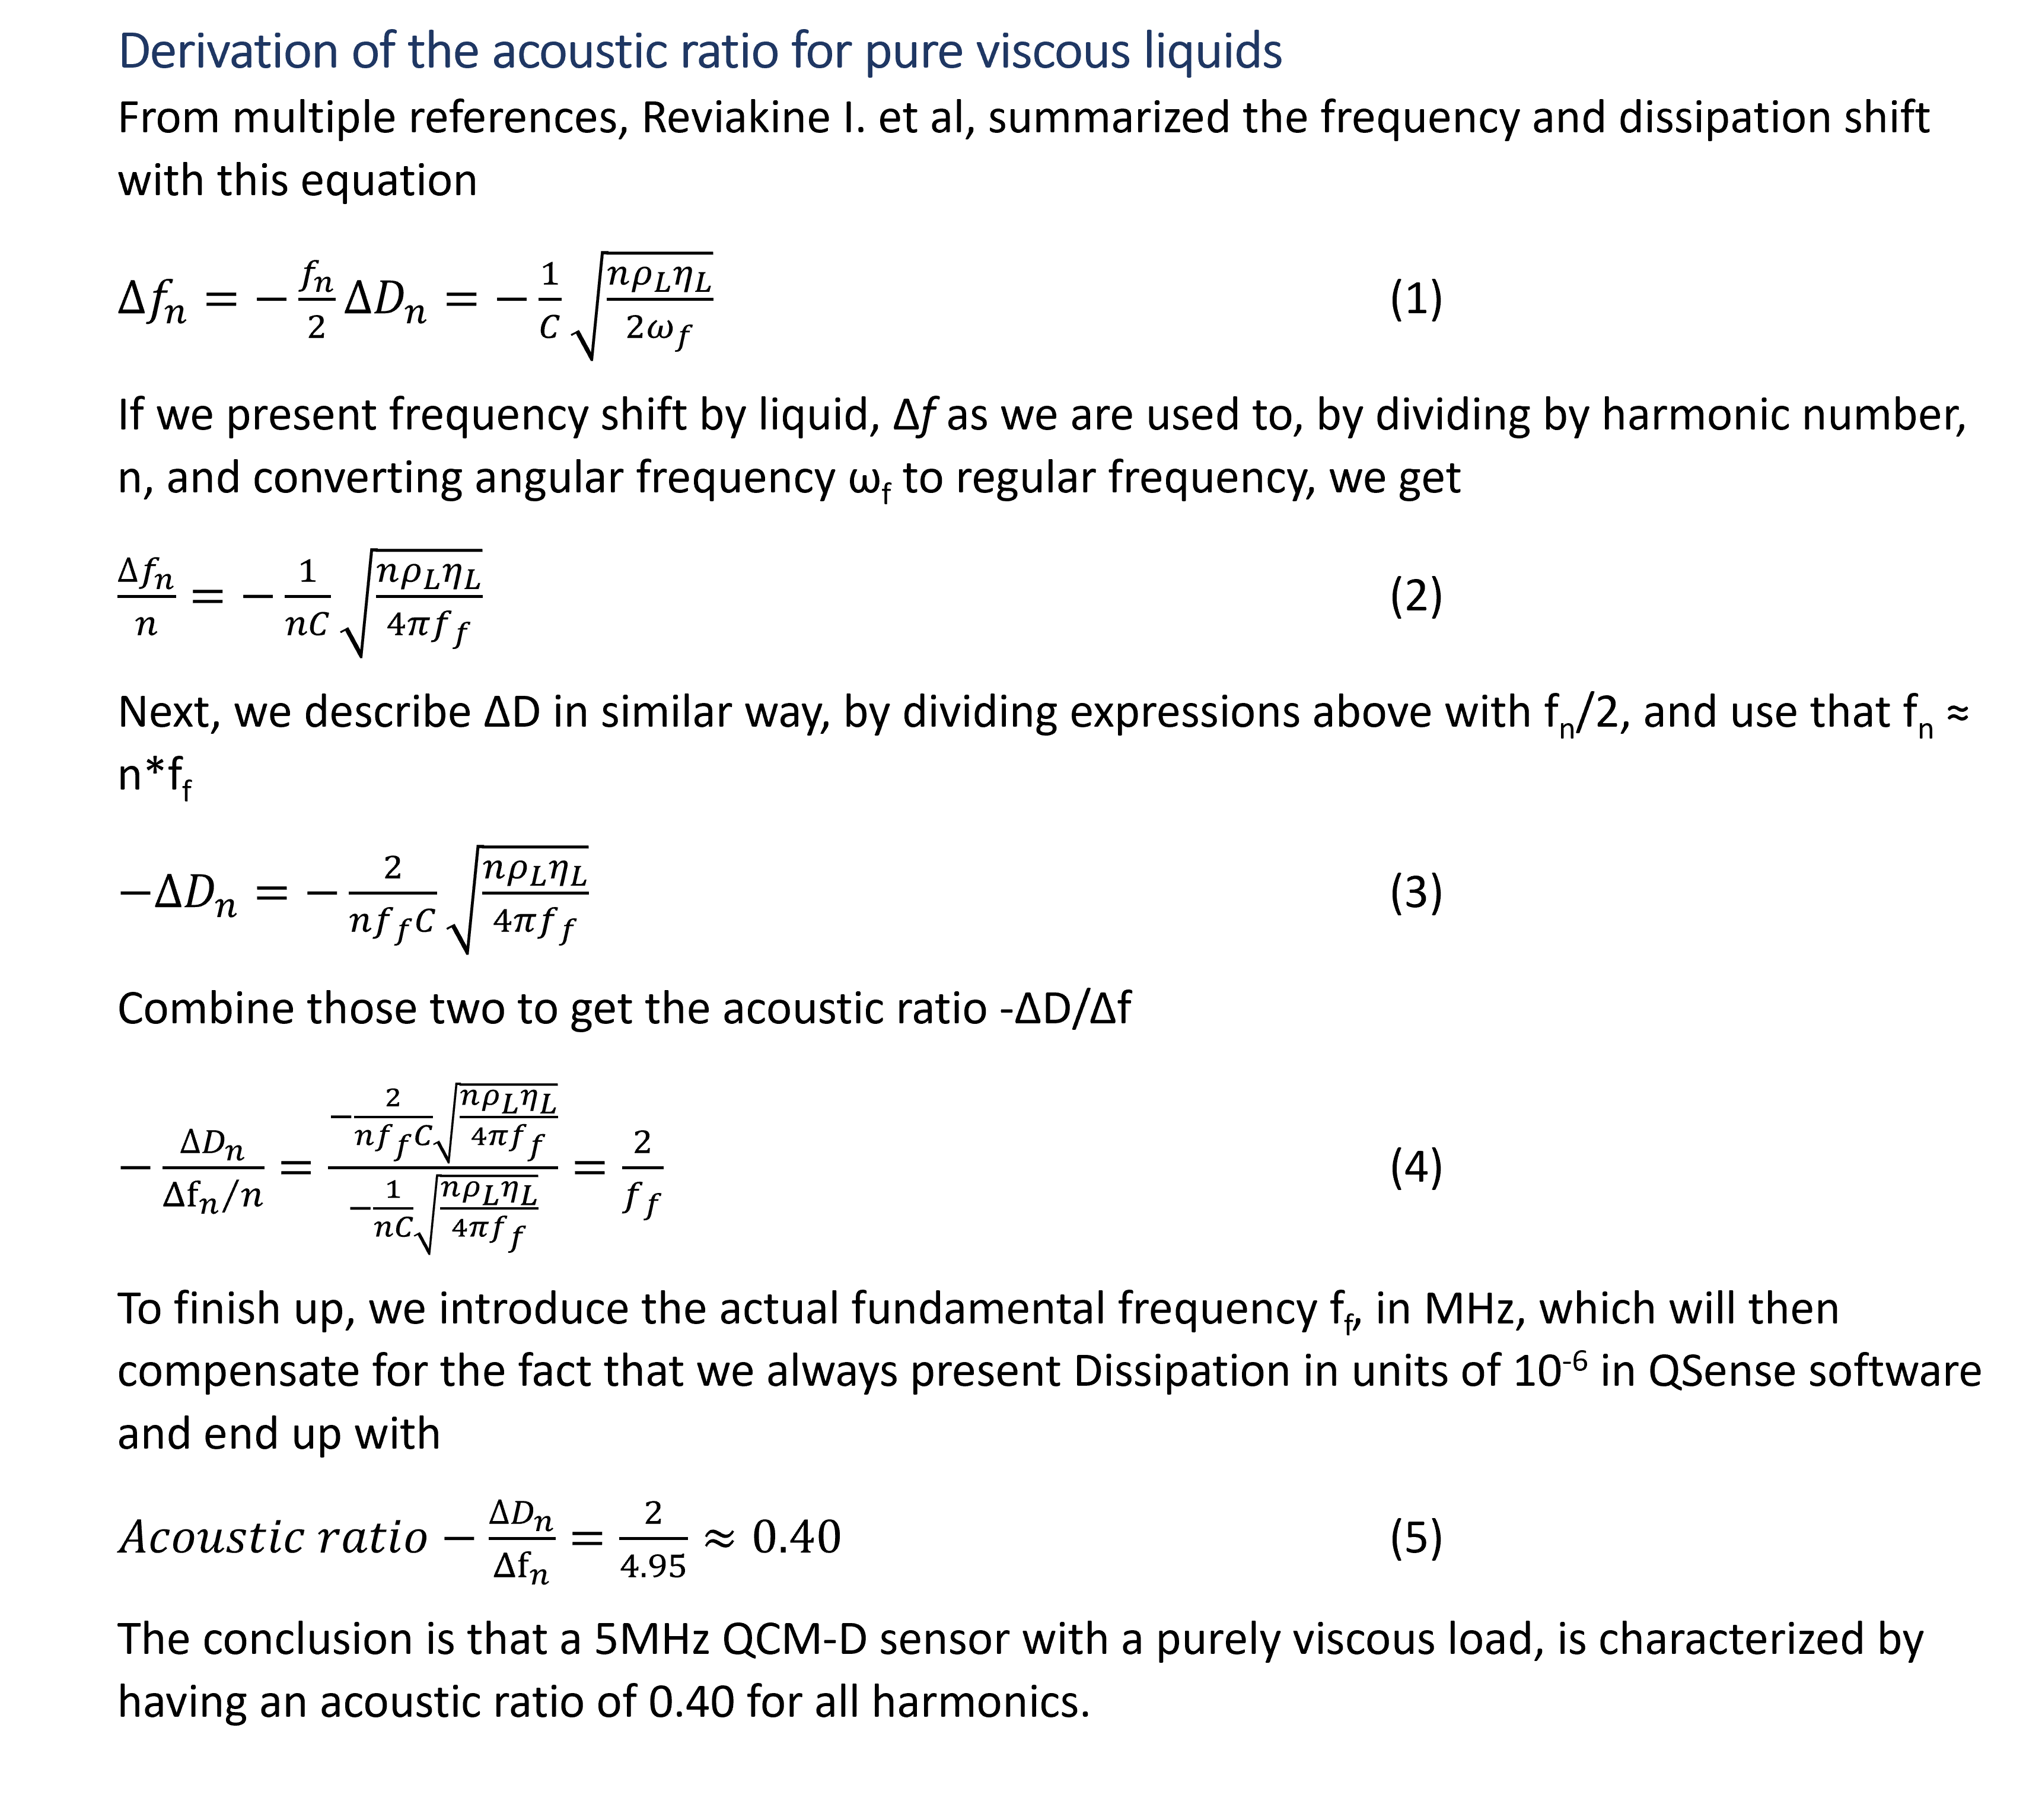
If you still hesitate as to whether the shift in f and D that you observe originate from changes of the bulk properties or if there is a change in adlayer mass, an additional clue to tell the two scenarios from one another is to look at the acoustic ratio, ΔD/Δf. For a 5MHz QCM-D sensor and a purely viscous load, i.e., if there is no mass adsorbed at the surface, the acoustic ratio is - 0.4 for all harmonics. Please note, however, that an acoustic ratio of -0.4 does not rule out the presence of an adlayer, and it doesn’t guarantee that material have not adsorbed at the surface.
Below follows the derivation of this number.
To complicate things a bit, we can also note that there exist situations that are not possible to strictly define as either bulk liquid shift or adsorption. There are situations where a surface promotes weak interaction, for instance a charged surface attracting ions in solution. Then a locally increased concentration of solutes near the surface could be interpreted as something in the middle between the bulk liquid case and the adsorption case. It might be difficult to detect this situation, but if you get data indicating only a liquid bulk shift by the methods described above, in a case where you introduce a sample but where there is no actual difference in viscosity and density of the liquid (for instance for very low concentrations of the solute) this may be the explanation for your observations.
A bulk shift is a shift in f and D originating in changes of the liquid bulk properties, i.e., the viscosity and density of the medium above the sensor. Typically, a bulk shift is instantaneous, shows symmetrical kinetics, and is reversible. If it is difficult to reveal whether the f and D signals are due to changes in the bulk or due to mass changes of the adlayer, we have here presented a quantitative method using the acoustic ratio, which will provide an additional clue to which of the scenarios that have taken place.
Download the overview to learn more about the QCM-D bulkshift.


Fredrik is a Senior Application Scientist at Biolin Scientific. After his Master of Science in Biosensors- and Microsystems technology he has worked with technology and application development in as diverse fields as electroporation, multivariate gas sensing, drug screening and surface science.