As the usage of engineered nanoparticles continues to grow, the risk of nanomaterial exposure to humans as well as the environment is increasing. Sunscreens, sports clothes, paints, coatings and medicines are all examples of products where nanomaterials are used. To avoid potential adverse effects, it is relevant to study how these nanoparticles interact with their surroundings. In this overview, we present examples of how nanoparticle interaction with a variety of surfaces can be analyzed.
One way to analyze nanoparticle-surface interaction is via surface sensitive technologies, such as QSense® QCM-D. This technology offers time-resolved information on mass uptake or mass loss from the surface of interest. It also provides information on material properties of the formed layer. The combined information on mass and material properties will provide unique insight on the interaction between the nanomaterials and solid surface analyzed.
Varying the material of the nanoparticles, the material of the solid surface and the ambient solvent conditions such as pH, salt concentration and temperature, specific nanoparticle-surface interactions of interest can be characterized. For example, nanoparticle-cell membrane interaction, which is relevant both for nanodrug screening and for nanoparticle toxicity screening, can be studied using biomimetic model systems such as lipid membranes on the sensor surface. The interaction with glass or plastic surfaces can reveal surface affinity, which is relevant for example in the context of filtering, in the removal of nanoparticles from water or air, and for preventing nanoparticle-induced fouling.
An example of how nanoparticle-surface interaction can be characterized by QCM-D is shown in this study, where the deposition rate as a function of salt concentration is analyzed [1]. In the study, a silica surface is exposed to fullerene nanoparticles in a range of salt concentrations (1, 10, and 30 mM NaCl at pH 5.2). The nanoparticle interaction with a silica surface coated with positively charged poly-L-lysine (PLL) at 1mM NaCl was also evaluated.
The QCM-D results, Fig. 1, show that the deposition rate increases with increasing electrolyte concentration [1]. The highest deposition rate was however obtained for the PLL-coated surface at a salt concentration of 1 mM. 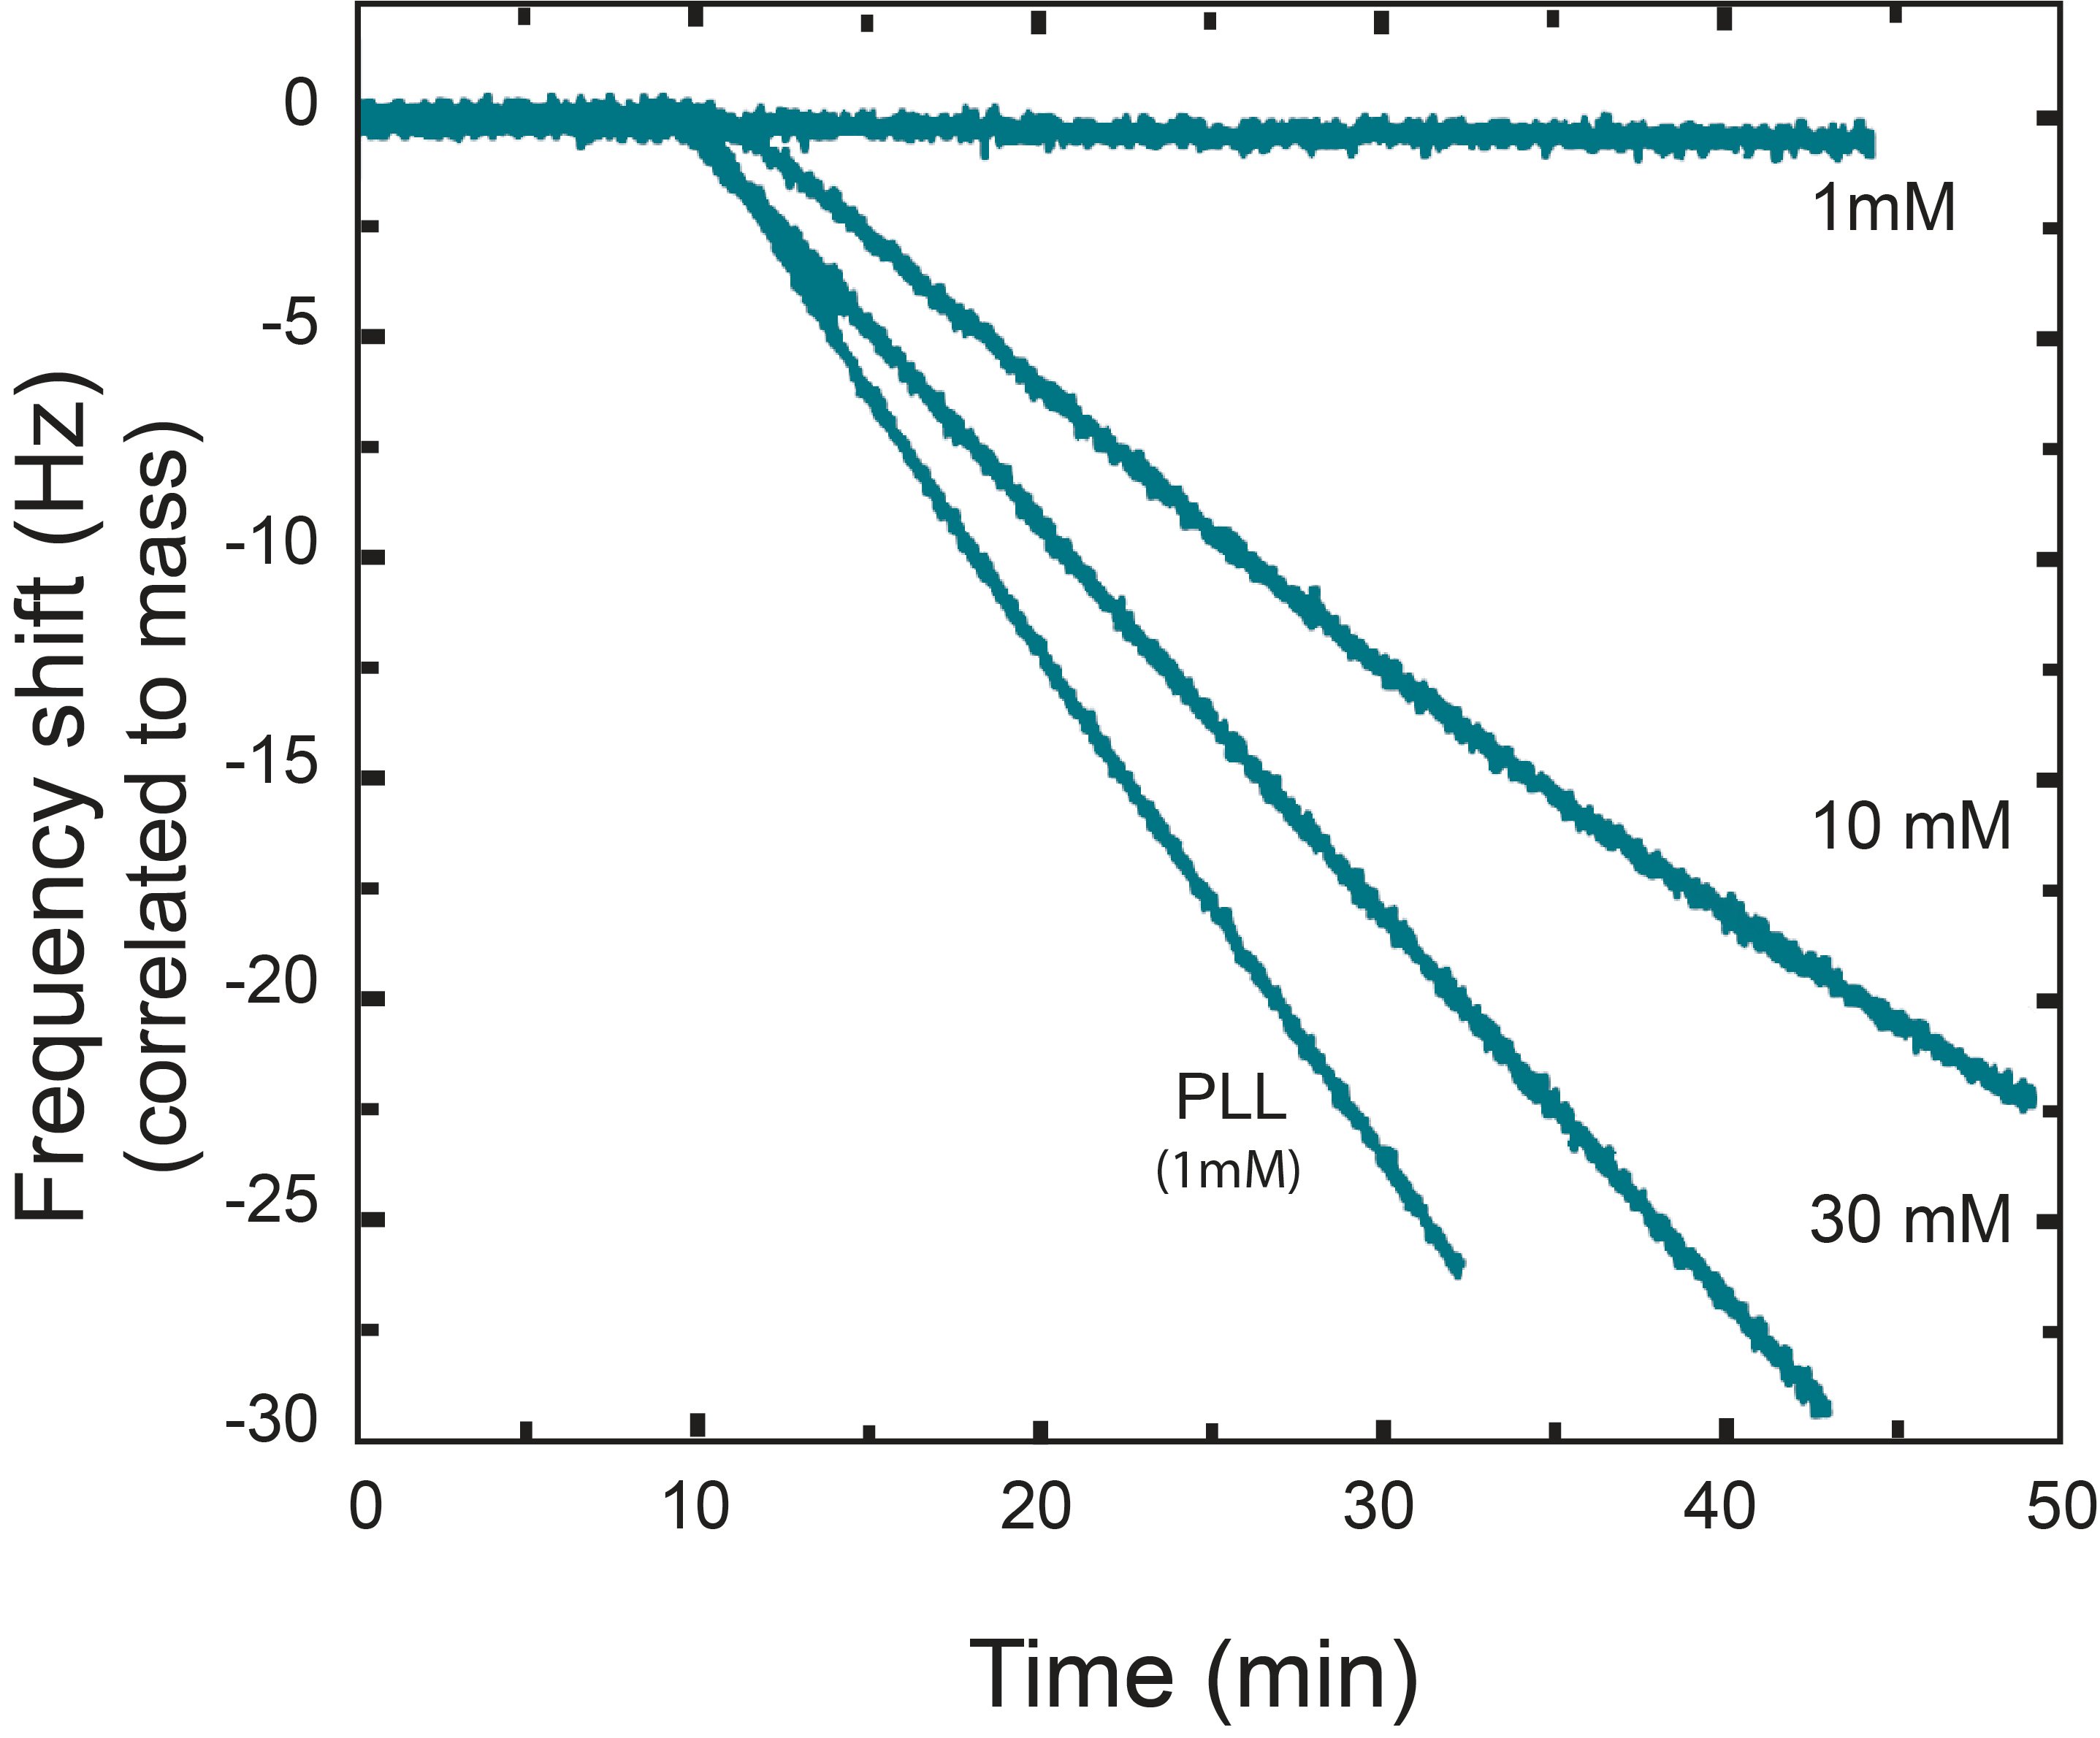
Figure 1. Deposition of fullerene nanoparticles onto a silica surface at different salt (NaCl) concentrations, characterized with QCM-D. A negative frequency shift corresponds to mass uptake at the surface, and the fastest uptake is observed for the PLL coated surface (1mM NaCl).
The transition from a macroscale to a nanoscale may unexpectedly introduce unknown material properties. Downsizing an object, the surface area to volume aspect ratio increases, and as the surface atoms of a material are generally more reactive than those in the bulk material, the physical and chemical properties may change. Nanotechnology offers an opportunity to improve existing products as well as to develop new ones, but due to the unpredictable change of interaction with surrounding surfaces this opportunity has to be carefully scrutinized. One way to analyze nanoparticle interaction with surfaces is via QCM-D which provides time-resolved information on mass changes at the surface of interest as well as detailed properties of the formed layer.
Download the overview to read more about how QSense QCM-D can be used to characterize nanoparticle interaction with surfaces.

Kenneth is a Director of Application & Development and Technology Transfer at Biolin Scientific