Data quality is fundamental to any scientific measurement. Without it, it becomes difficult to know whether an observed response reflects the system being studied or uncertainty in the measurement itself. In QCM-D (Quartz Crystal Microbalance with Dissipation monitoring), high-quality data allows you to distinguish real surface processes from noise, drift, and experimental artefacts, supporting confident interpretation of adsorption, desorption, film formation, and structural changes at the sensor surface.
This becomes especially important when the measured response is small, slow, or built up over several experimental steps. Low molecular weight interactions, low surface coverage, thin films, dilute samples, slow adsorption kinetics, and multi-step surface protocols all place high demands on the measurement. In these cases, low noise, long-term stability, reliable harmonic readout, and controlled measurement conditions can determine how confidently the result can be interpreted.
Summary
- Data quality helps distinguish real surface processes from noise, drift, and experimental artefacts.
- Low noise is essential when measuring small frequency shifts from weak binding, dilute samples, low surface coverage, or thin films.
- Long-term stability is important for slow processes and extended QCM-D measurements.
- Reliable harmonic readout supports interpretation of thin, hydrated, or viscoelastic films.
- Stable measurement conditions help reduce avoidable artefacts and improve confidence in the result.
Key aspects of data quality in QCM-D
QCM-D follows surface processes in real time by monitoring shifts in resonance frequency, Δf, and dissipation, ΔD, of an oscillating quartz crystal sensor. Frequency shifts are related to changes in the mass coupled to the sensor surface, while dissipation shifts describe changes in energy loss during sensor oscillation. Together, Δf and ΔD help you follow adsorption, desorption, film formation, and changes in the mechanical character of the surface layer.
For many applications, the challenge is not only to measure Δf and ΔD, but to measure them with low enough noise and sufficient stability to distinguish a true surface response from uncertainty in the measurement. In practice, this depends on several connected factors. Low short-term noise helps small shifts stand out from the baseline. Long-term stability makes it possible to follow gradual processes without confusing drift with sample response. Reliable harmonic readout supports comparison between harmonics and provides better input for analysis. Stable temperature conditions and correct resonance tracking help reduce avoidable artefacts before and during the measurement. Together, these factors determine how confidently small, slow, or complex surface processes can be evaluated.
Small signals require low noise
Small frequency shifts can carry important information. They may indicate weak binding, early adsorption, partial surface coverage, trace contamination, or the formation of a very thin film.
But when the expected response is small, noise becomes a limiting factor. If the noise level is high relative to the signal, it becomes difficult to decide whether the observed change is real. A low noise floor makes small shifts easier to detect, helps define stable baselines, and reduces uncertainty when comparing endpoint levels between different samples or steps.
This is especially important when working with low molecular weight analytes, low surface coverage, dilute samples, thin films, and weak interactions. In these cases, the scientific question may depend on changes that are only a few hertz, or less. The lower the uncertainty in the signal, the easier it becomes to follow the process as it develops, rather than only judging the final endpoint.
Slow processes require long-term stability
Not all surface processes happen quickly. Adsorption from low-concentration samples, gradual layer rearrangements, coating stability studies, fouling processes, and long binding assays may require measurements over tens of minutes or several hours.
In these cases, long-term stability becomes essential. If the baseline drifts on the same scale as the sample response, drift may be mistaken for continued adsorption, desorption, swelling, compaction, or another surface-related process. Stable data over time makes it easier to separate the behaviour of the surface from the behaviour of the measurement system.
This is particularly important in experiments where the response builds slowly. A small but steady frequency change may contain meaningful kinetic information, but only if the measurement is stable enough to show that the change belongs to the sample and not to the instrument baseline.
Multi-step experiments accumulate uncertainty
Many QCM-D workflows involve several sequential steps: establish a baseline, introduce sample, rinse, introduce another sample, regenerate, or build a film layer by layer.
Each step adds a new interpretation point. Did the layer adsorb? Was the rinse stable? Did the next component bind? Did the surface return toward baseline after regeneration? In a multi-step protocol, small uncertainties can accumulate over time.
Low noise, stable baselines, and reliable readout throughout the experiment help preserve confidence from the first step to the last. They also make it easier to compare responses between steps, identify unexpected changes, and decide whether a later response is truly caused by the latest sample addition or influenced by earlier drift or instability.
Complex films need reliable harmonic information
For thin, hydrated, or viscoelastic films, interpretation often depends on more than a single frequency trace. Dissipation and harmonic behaviour can provide important information about how the layer interacts with the oscillating sensor.
Reliable harmonic readout helps you compare responses across harmonics and supports more informed analysis of layer properties. This becomes particularly important when the film is not rigid, when the layer changes structure during the experiment, or when the data will be used for viscoelastic modelling.
In practical terms, good harmonic data can help you move beyond the question “did material adsorb?” toward more detailed questions, such as whether the layer became more hydrated, more compact, more rigid, or more dissipative during the experiment.
The foundation for quality data is laid before the experiment
Data quality is seen in the measurement output: low noise, stable baselines, low drift, and reliable frequency and dissipation response. But the foundation for achieving that quality is laid before the experiment begins.
Stable temperature, suitable resonance quality, correct harmonic tracking, and a stable baseline all help reduce avoidable artefacts. Establishing stable measurement conditions before sample introduction increases the likelihood that the measured response reflects the surface process being studied, rather than changes in the measurement setup.
How can data quality be evaluated?
Data quality should be evaluated under conditions that resemble the intended measurement. A stable baseline is useful, but it does not tell the full story. For demanding applications, it is also important to assess performance with real samples and real surface layers.
Useful indicators include:
- The ability to resolve a small frequency shift during adsorption.
- The noise level during a stable measurement window.
- The drift over an extended time.
- The stability of the signal after sample exposure.
- The consistency of the response across relevant harmonics.
Together, these indicators show whether the data quality is sufficient for the type of experiment being performed. They also help you understand the practical limits of what can be detected and interpreted with confidence.
A practical example: QSense Core One
QSense Core One is designed with data quality as a central objective. To show what this means in practice, data quality was evaluated in a real QCM-D experiment following the build-up of a polyelectrolyte multilayer on gold.
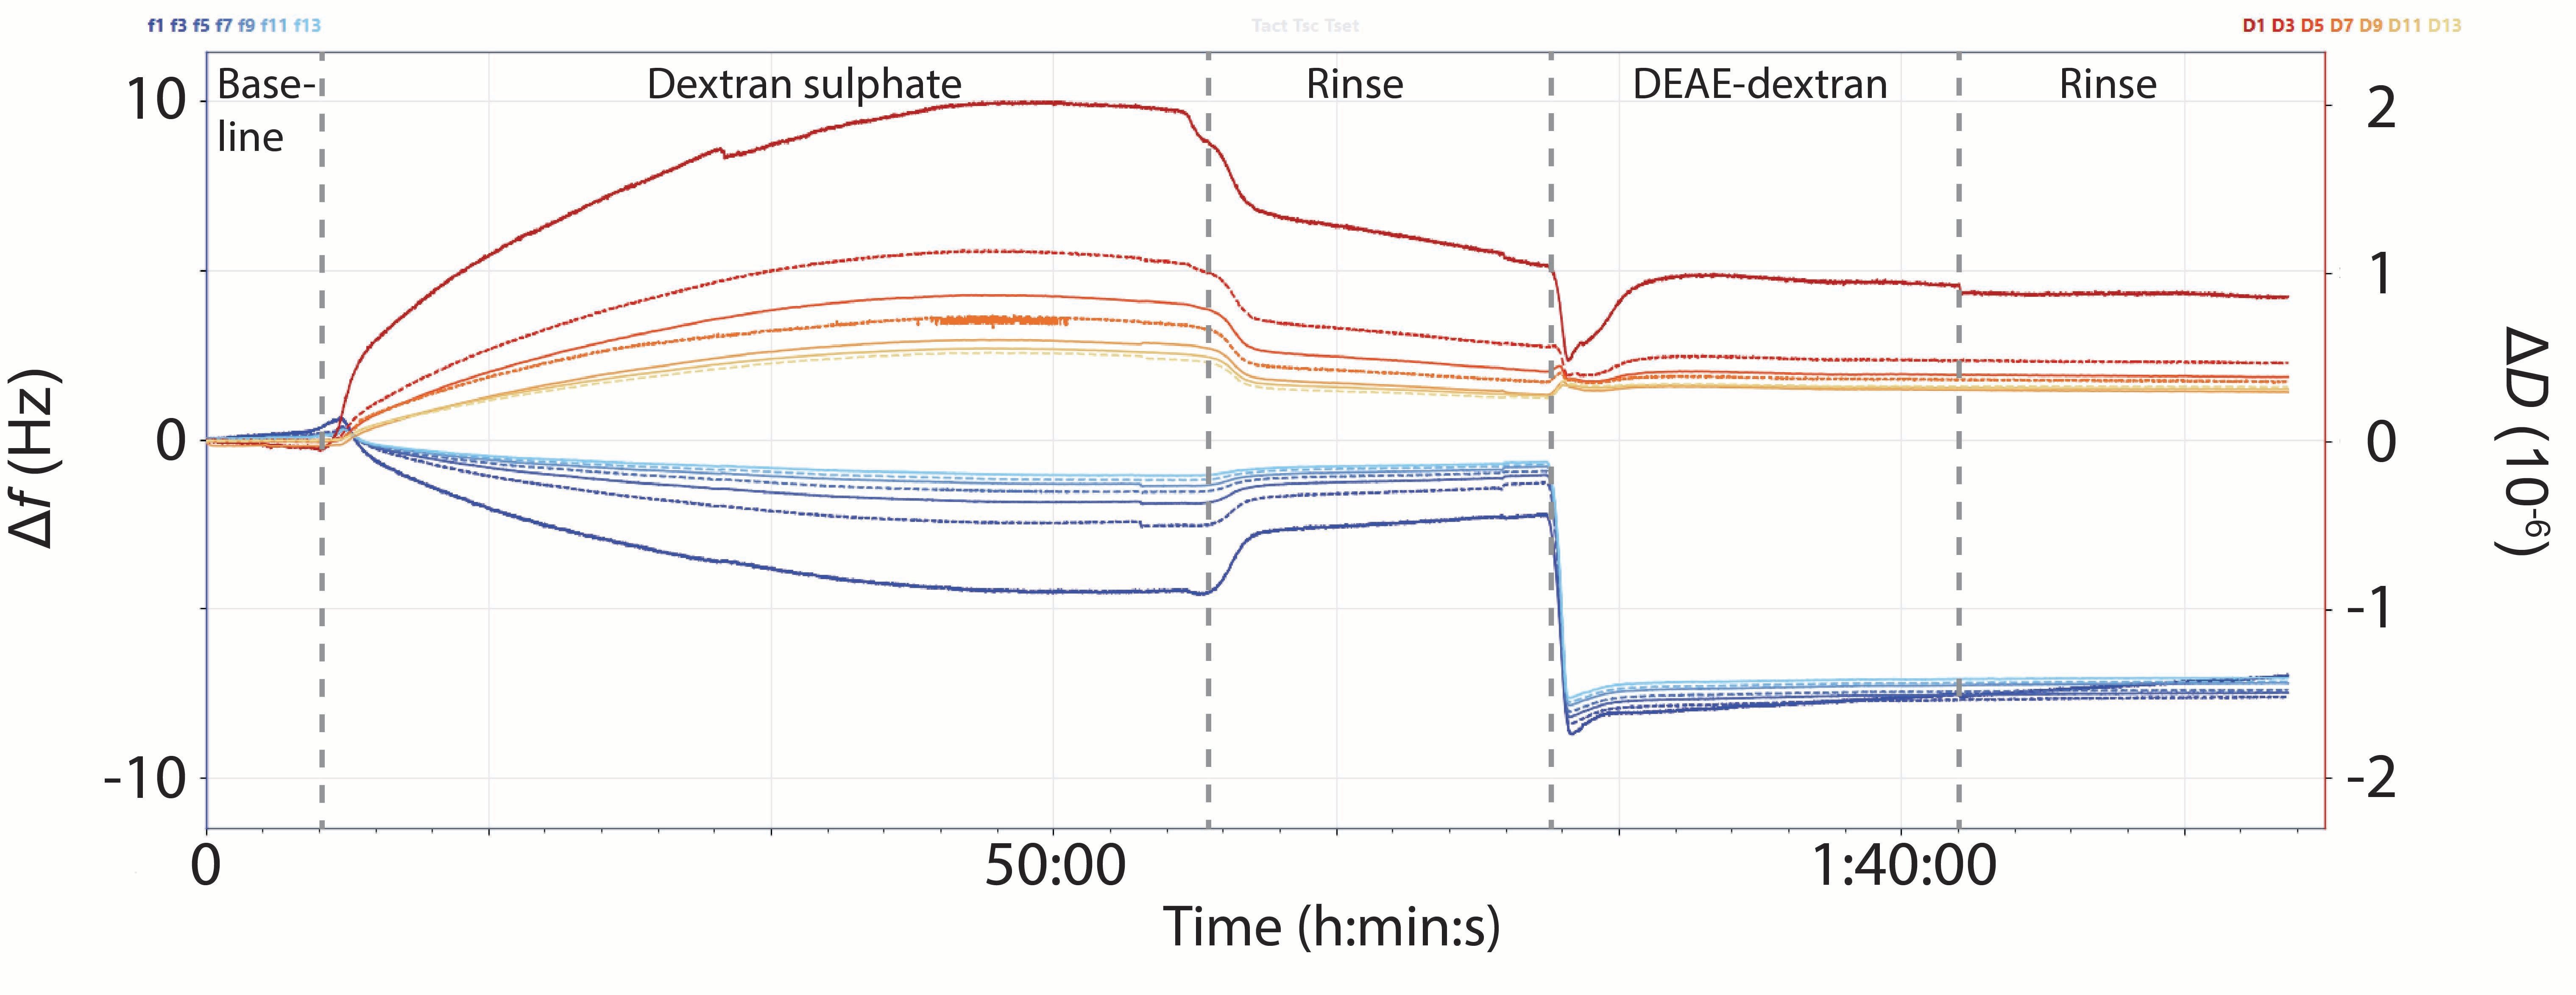
Figure 1. QCM-D measurement of a polyelectrolyte multilayer on gold. The dataset illustrates how small-signal resolution, long-term stability, and steady-state noise can be evaluated under real measurement conditions.
As shown in Figure 1, the example combines several conditions that place demands on the measurement: small adsorption-related frequency shifts, an extended run time, and steady-state periods where signal stability and noise can be assessed under real sample conditions.
The dataset is used to answer three practical questions:
- Can a small adsorption-related frequency shift be resolved?
- Does the signal remain stable during an extended measurement?
- What noise level is observed at steady state on a real adsorbed layer?
Together, these observations show how small-signal resolution, long-term stability, and low noise can be evaluated in a realistic QCM-D workflow.
See reliable QCM-D data in practice
When QCM-D experiments are demanding, data quality shapes what can be observed, trusted, and interpreted. Low noise, long-term stability, reliable harmonic readout, and controlled measurement conditions all help distinguish real surface processes from uncertainty.
If you want to go beyond the concept, the technology note provides the supporting data. It walks through the reference experiment, highlights where low noise and long-term stability are visible in the measurement, and explains how these data-quality indicators support confident QCM-D interpretation.
Download the technology note to explore the full dataset and interpretation.