The general description of QCM-D technology is that it is a balance for very small masses. And indeed, it is, but the information that you can extract from the data is so much more than just mass.
The collected parameters f and D, and particularly at multiple harmonics, allow for the quantification of both mass and thickness as well as viscoelastic properties of the layer at the surface. Add to this, the fact that the information is time-resolved. This means that not only can you characterize the final formed layer, but you can also follow the dynamic evolution of the surface interactions and get an understanding of how these happen and why. The measured parameters can also provide information on the level of hydration, and changes thereof, such as film swelling or film collapse.

The information offered by QCM-D analysis enables the characterization and optimization of surface interactions and processes. Questions that can be answered are for example if there is an interaction taking place or not, how much material that adsorbs or desorbs, and how fast the process is. Below, we present a summary of the parameters and information that you can extract with QSense QCM-D
The mass uptake is probably the parameter most associated with the QCM instruments. Quantifying the mass uptake at the surface will indeed tell you for example if you have formed a monolayer or a bilayer at the surface, and how long it took to form. It will also tell you how the formation process evolved and if the molecules are staying at the surface or if they are leaving, Fig.1.
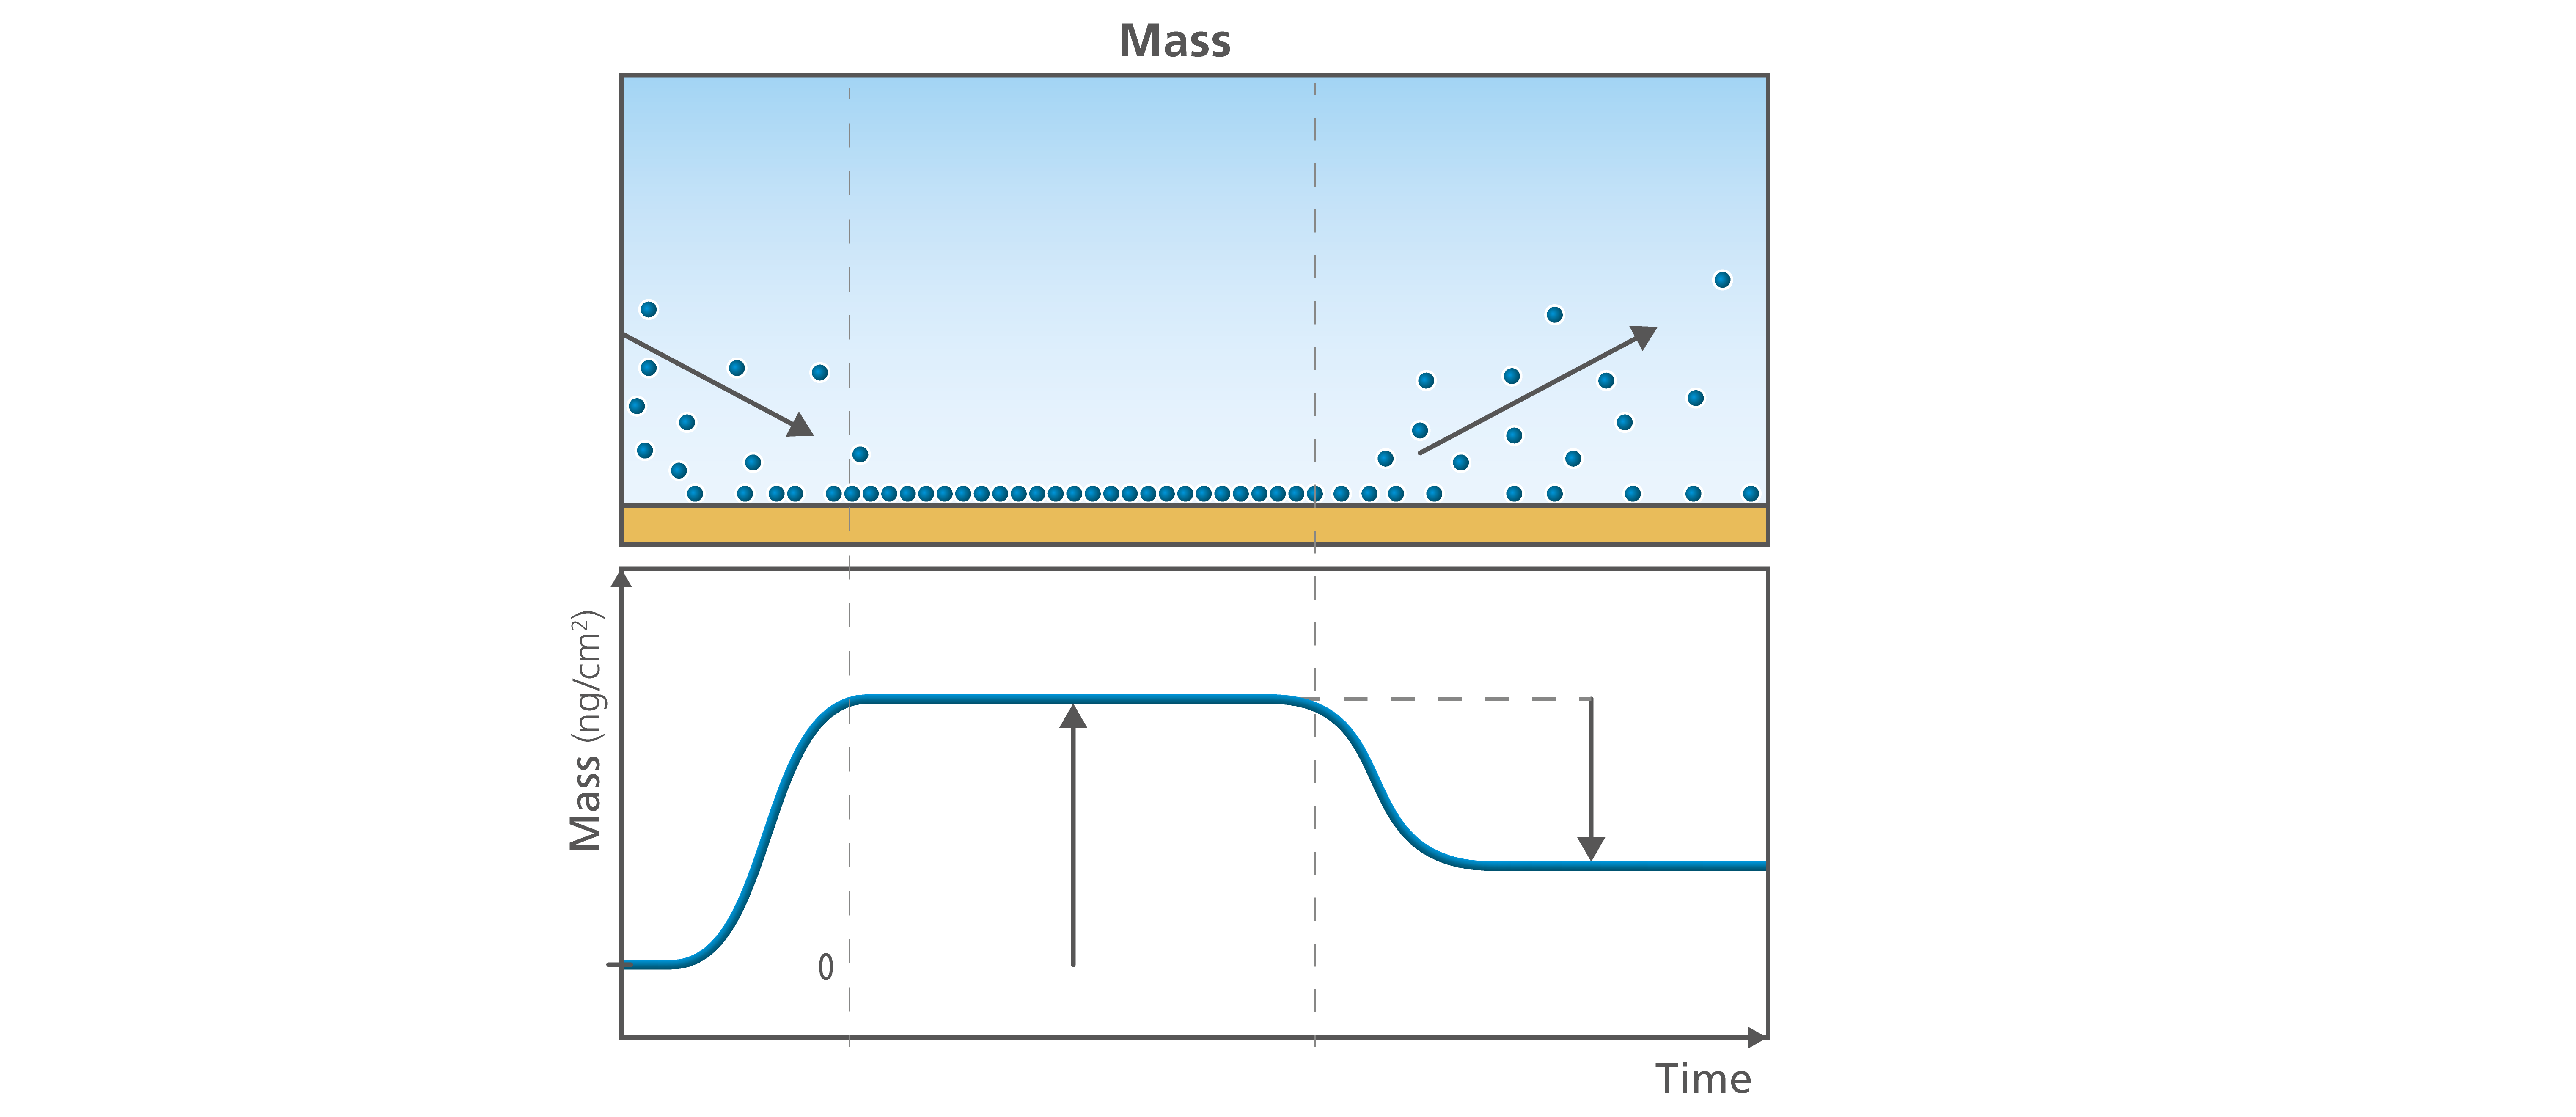
Figure 1. The time resolved information on the mass allows you to follow if the molecules interact with the surface or not. You can follow how they adsorb (left) or desorb (right), and quantify the final amount of material added to or lost from the surface.
The layer thickness is tightly connected to the layer mass. If you know the mass, you can calculate the thickness. The thickness is relevant when it comes to understanding for example how the molecules are arranging themselves at the surface; are they lying down, or will they stretch out from the surface? It may also be a relevant parameter to characterize to verify a thin film process or to evaluate the reproducibility of the measurement, Fig. 2.
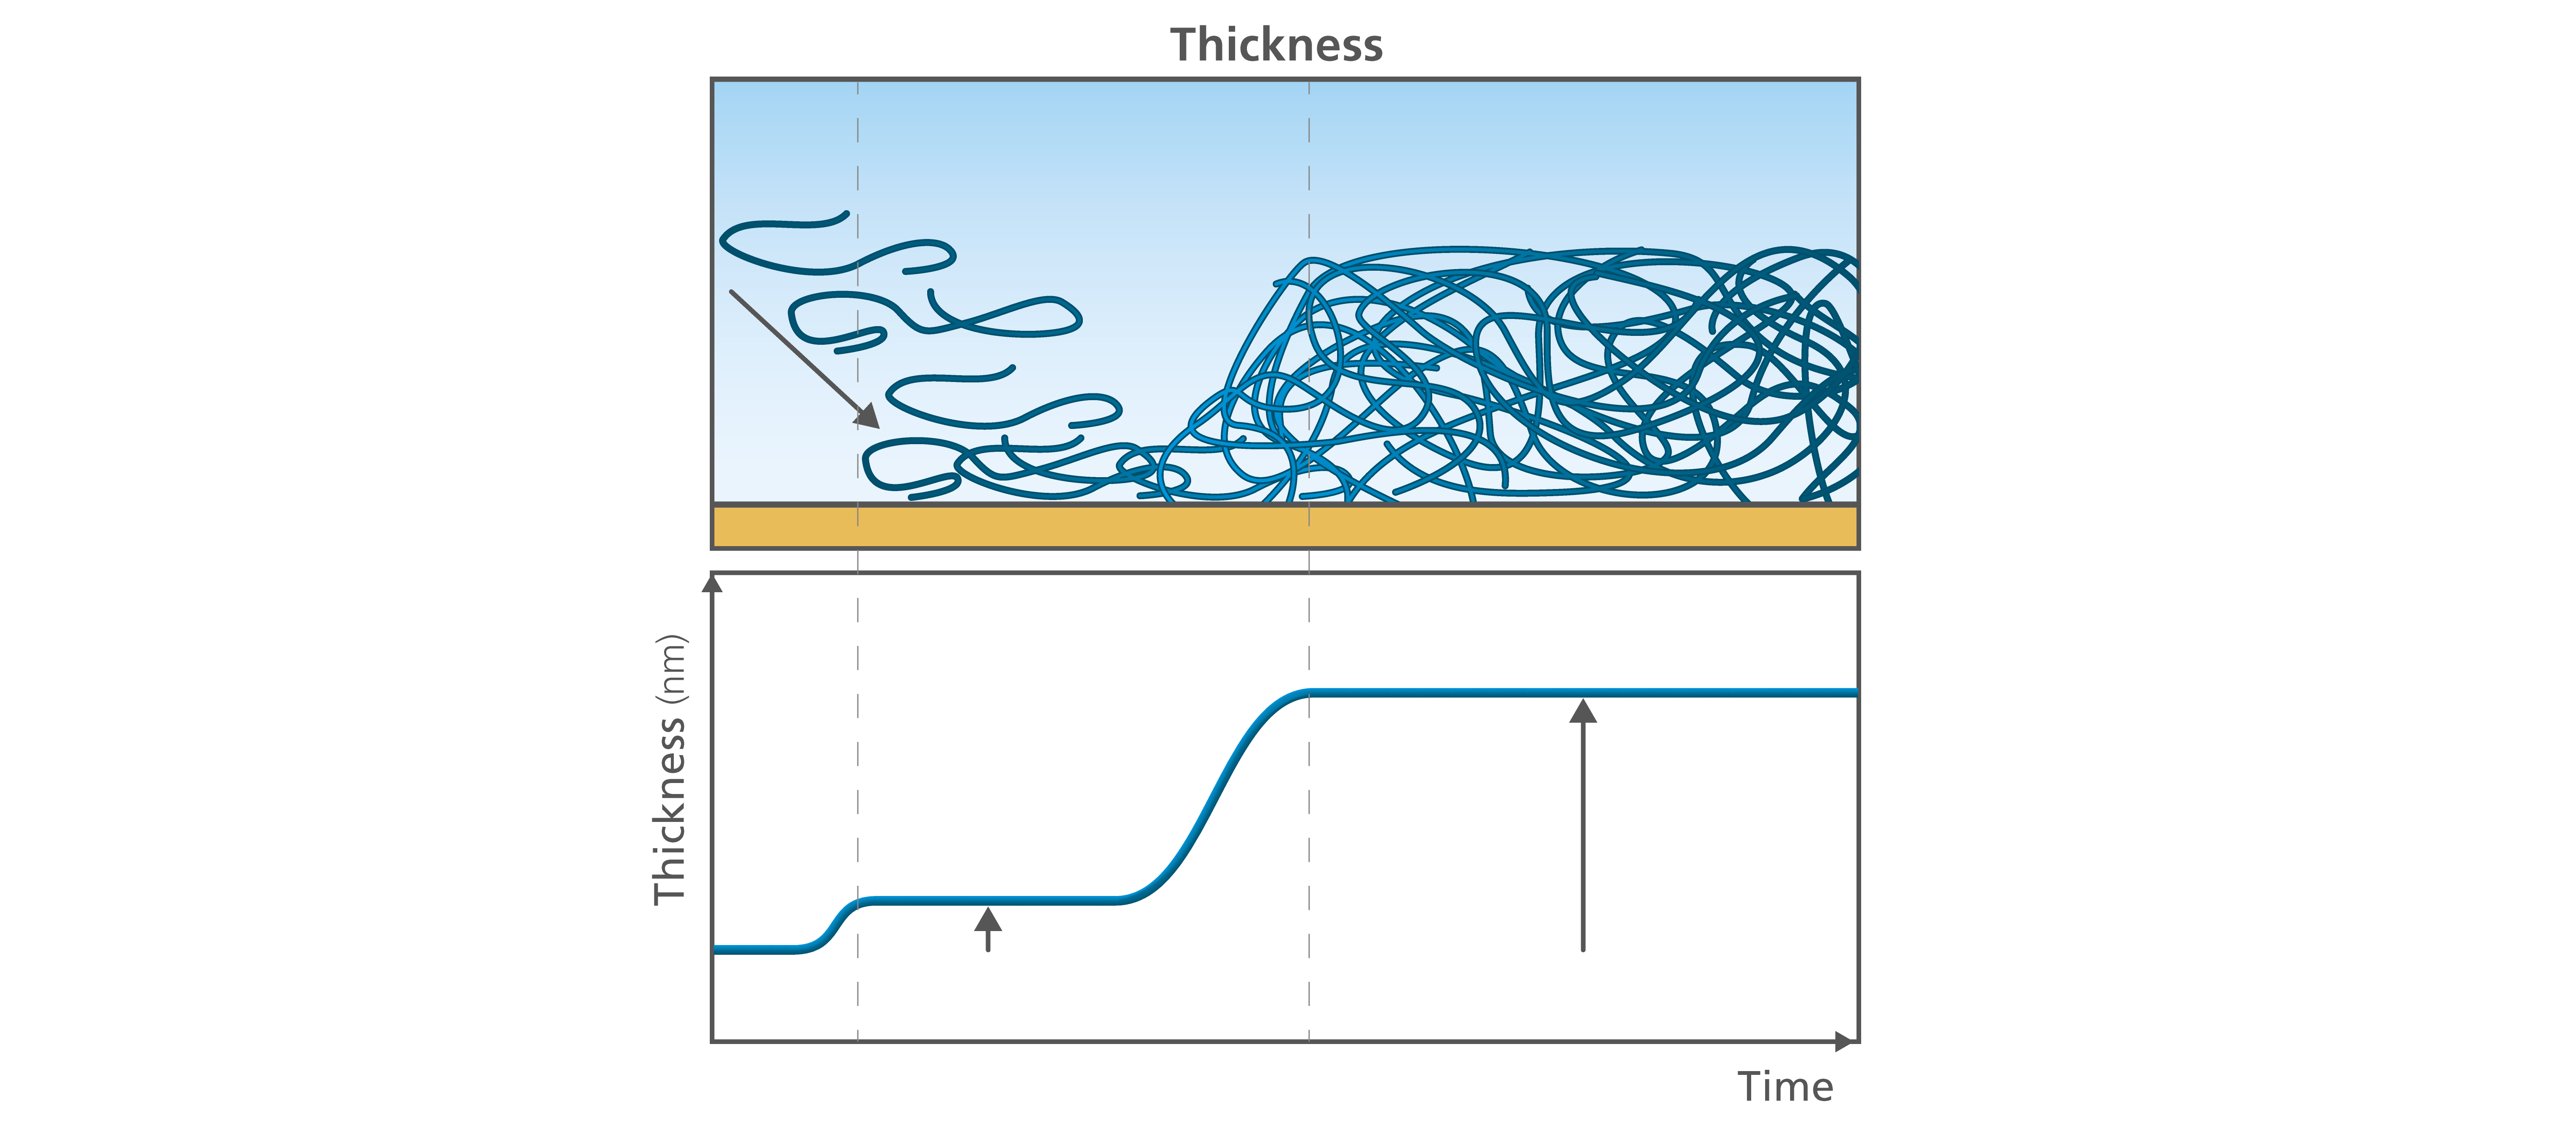
Figure 2. The time resolved information on the thickness allows you to follow the layer build-up as well as conformational changes over time.
The viscoelastic properties tell you how soft or rigid your layer is. The time-resolved viscoelasticity provides information on how the conditions, and their variations, affect the layer structure. Will the layer get more or less soft when you change the salt concentration? What happens when you change the temperature? Or the surface material? Combined with the thickness information, the viscoelasticity will offer a good understanding of the molecular arrangement at the surface. For example, a thick and soft layer indicate a different molecular arrangement at the surface than results revealing a thick and rigid, or a thin and rigid layer, Fig. 3.
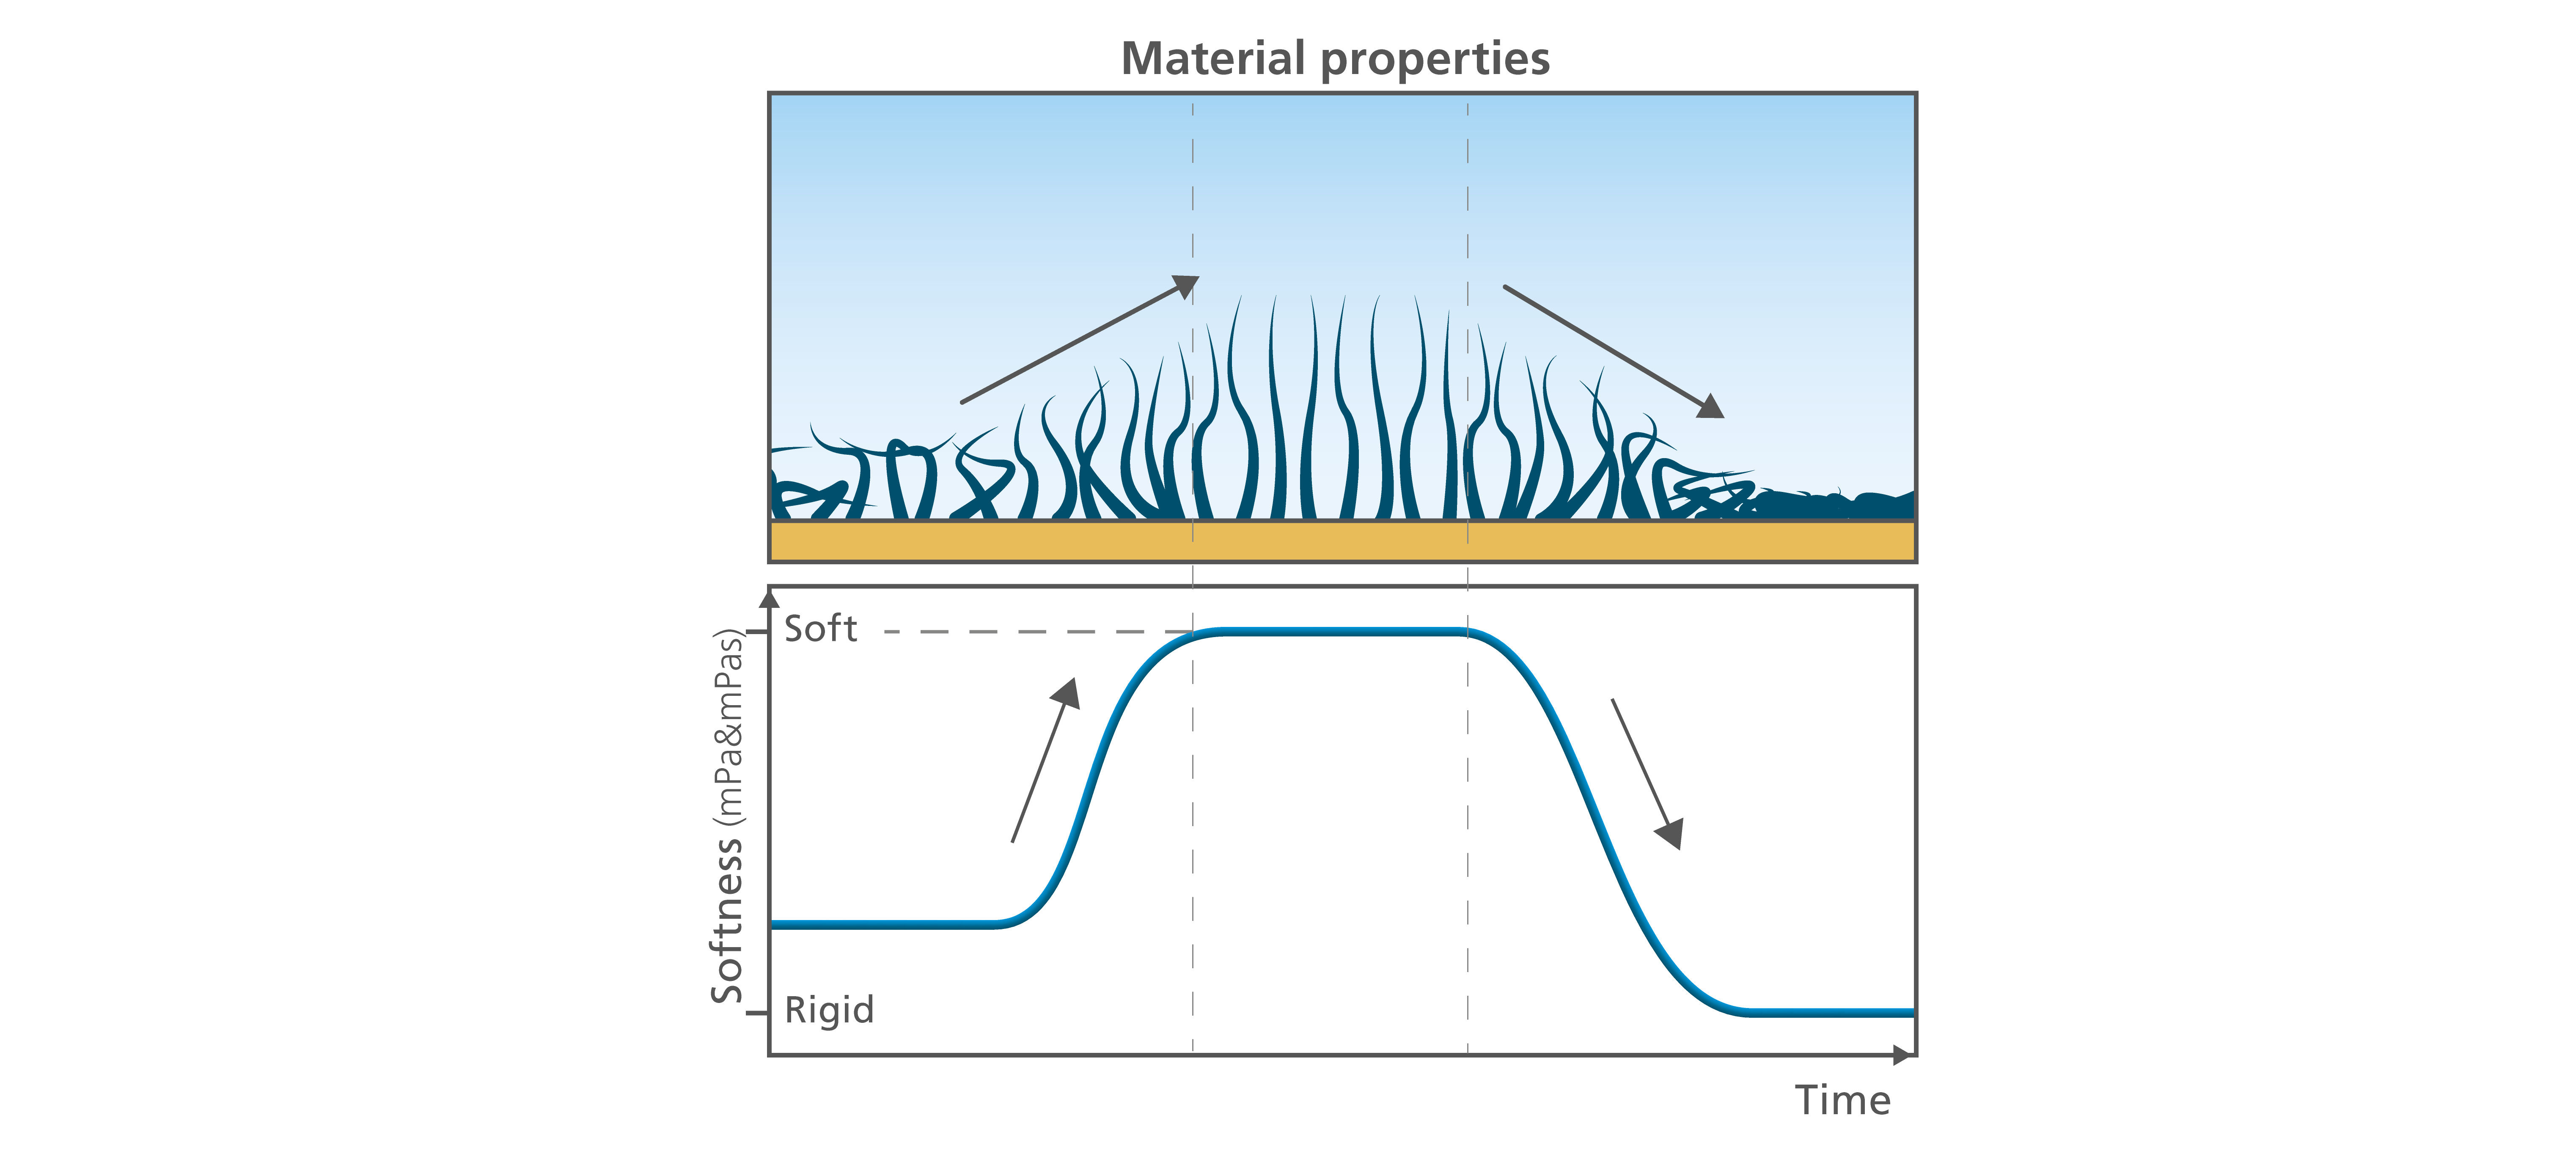
Figure 3. The time resolved viscoelasticity provides information on the layer softness.
Information on the final uptake amounts of mass and thickness are very informative, but sometimes the way which you get to the final layer is what is of interest. In this case the rates are relevant, Figure 4. What is the adsorption or uptake rate? How fast is mass being added to the surface, and is the rate the same during the entire process or does it vary with time? Here you can get an understanding of for example how the molecules interact with the surface, and if the process that you study depends on the concentration at the surface. The rate of mass loss can also be of interest. Identifying whether mass is lost or not, and how fast or slow this process is during certain conditions can even be critical. Examples could be to evaluate if your enzymes are removing material from the surface as efficiently as they should, if a protein will desorb at a certain pH or how fast your drug containing polymer matrix will release its components, Fig. 4.
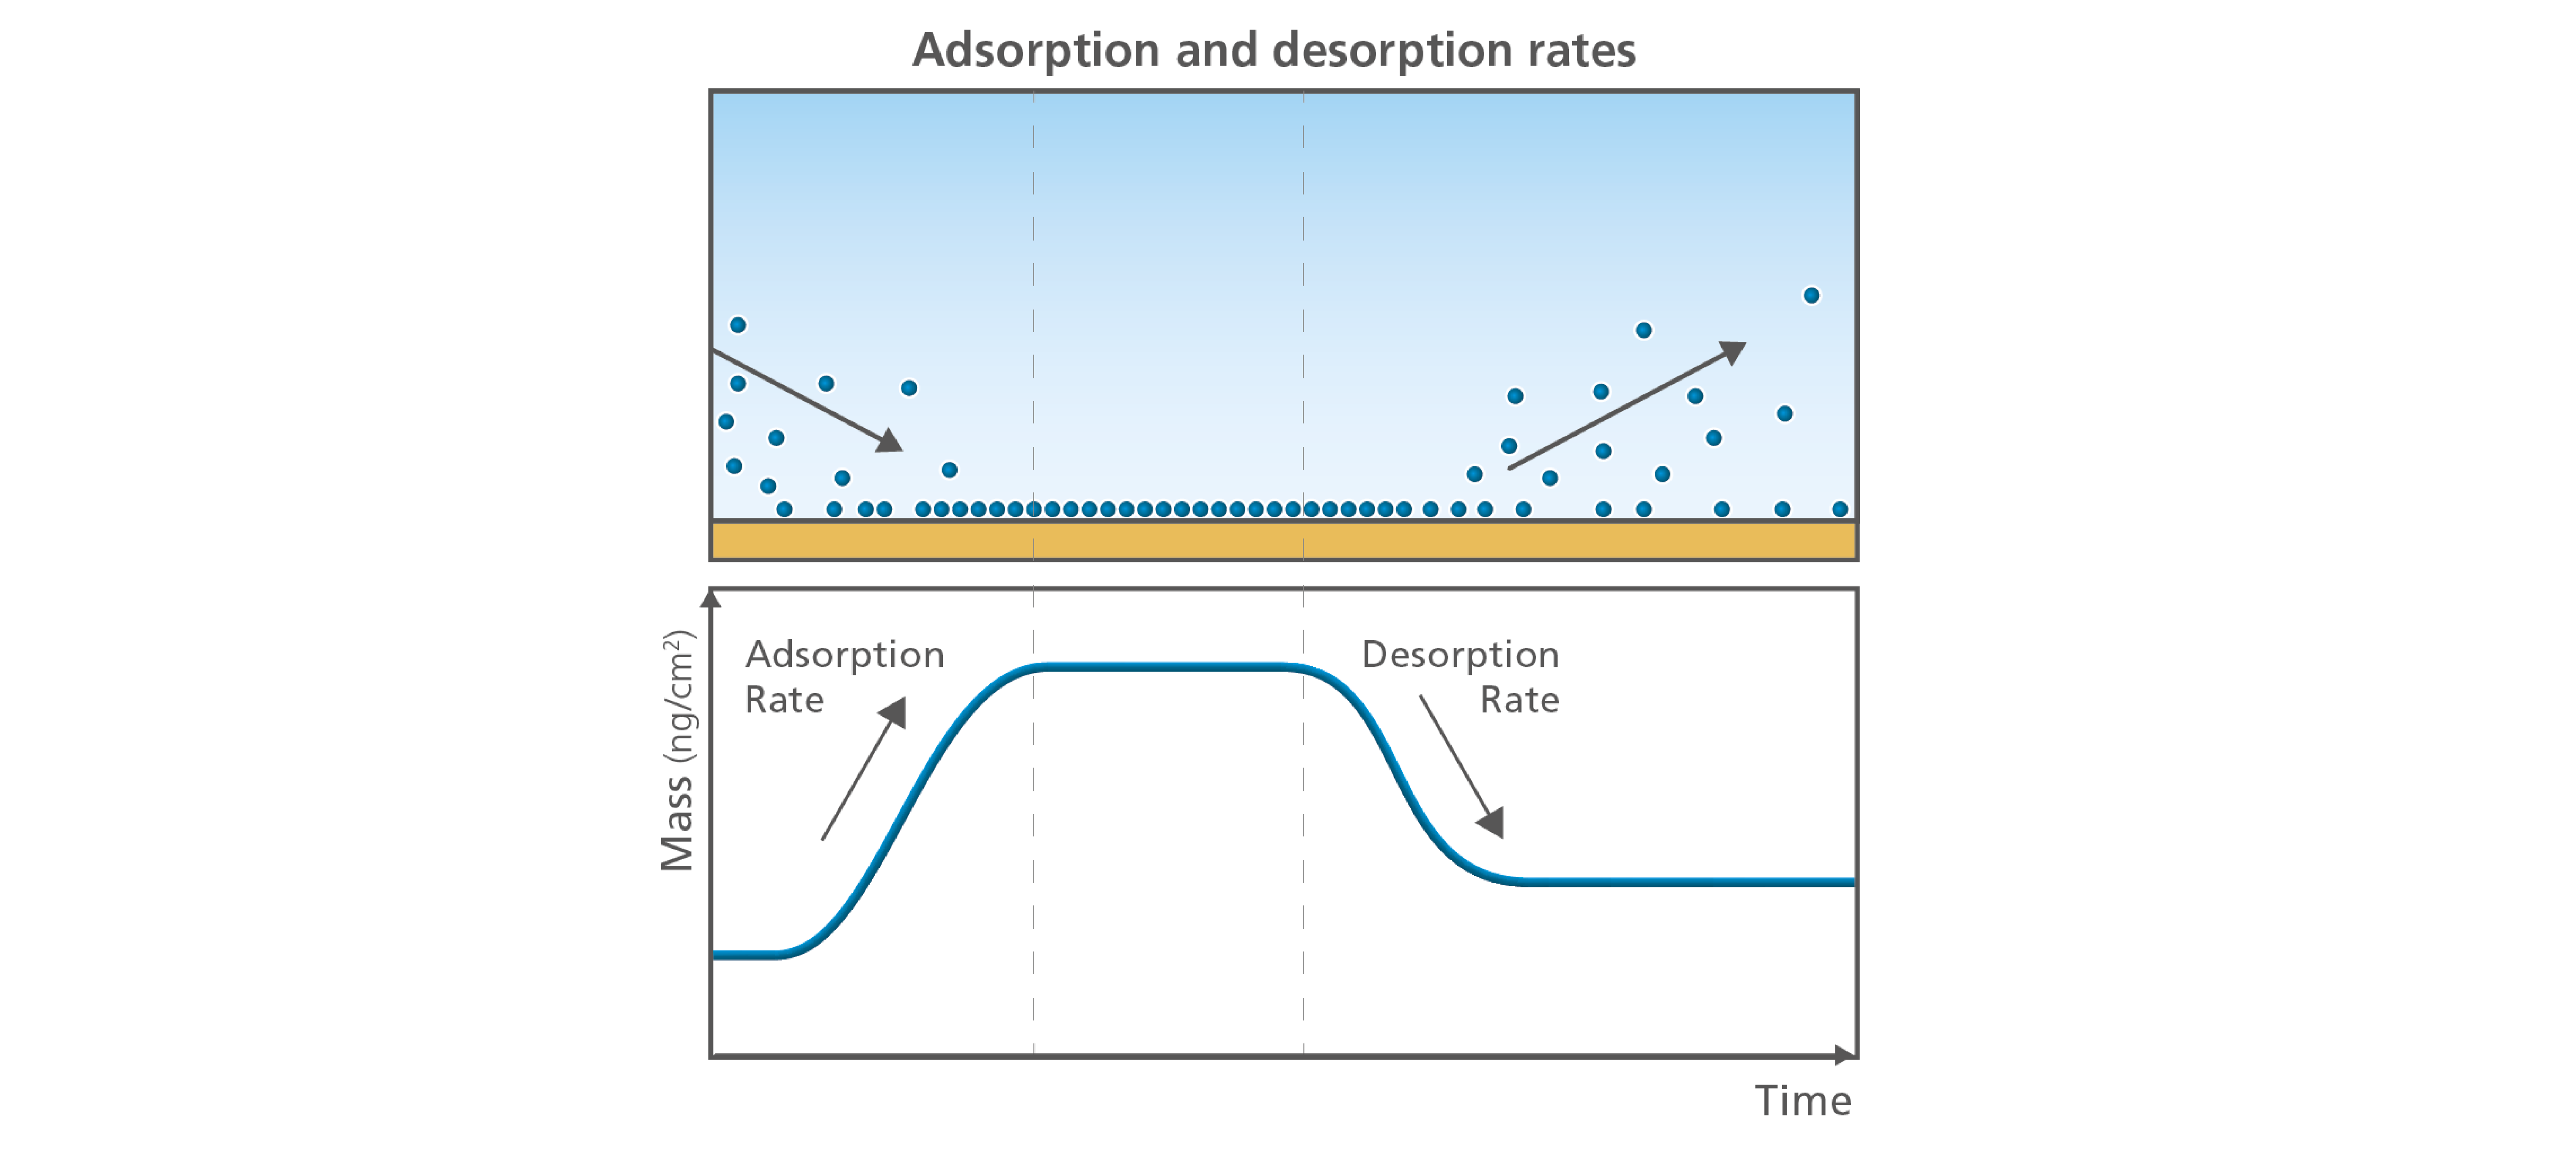
Figure 4. The adsorption and desorption rates are characteristic parameters of molecule-surface interaction.
The time resolved parameters of mass, thickness and viscoelasticity allows you to detect when surface interactions take place, and what the character of these interactions are. Eliminating time as an explicit parameter, however, it is possible to unveil if there are different phases, for example in the adsorption process. Plotting the dissipation as a function of the frequency, you get the softness to mass ratio which reveals whether the molecules interact stronger with the surface or with each other. Mapping the interaction as a function of molecule, sample concentration, surface material and ionic strength can increase the fundamental understanding of the system under study, Fig. 5.
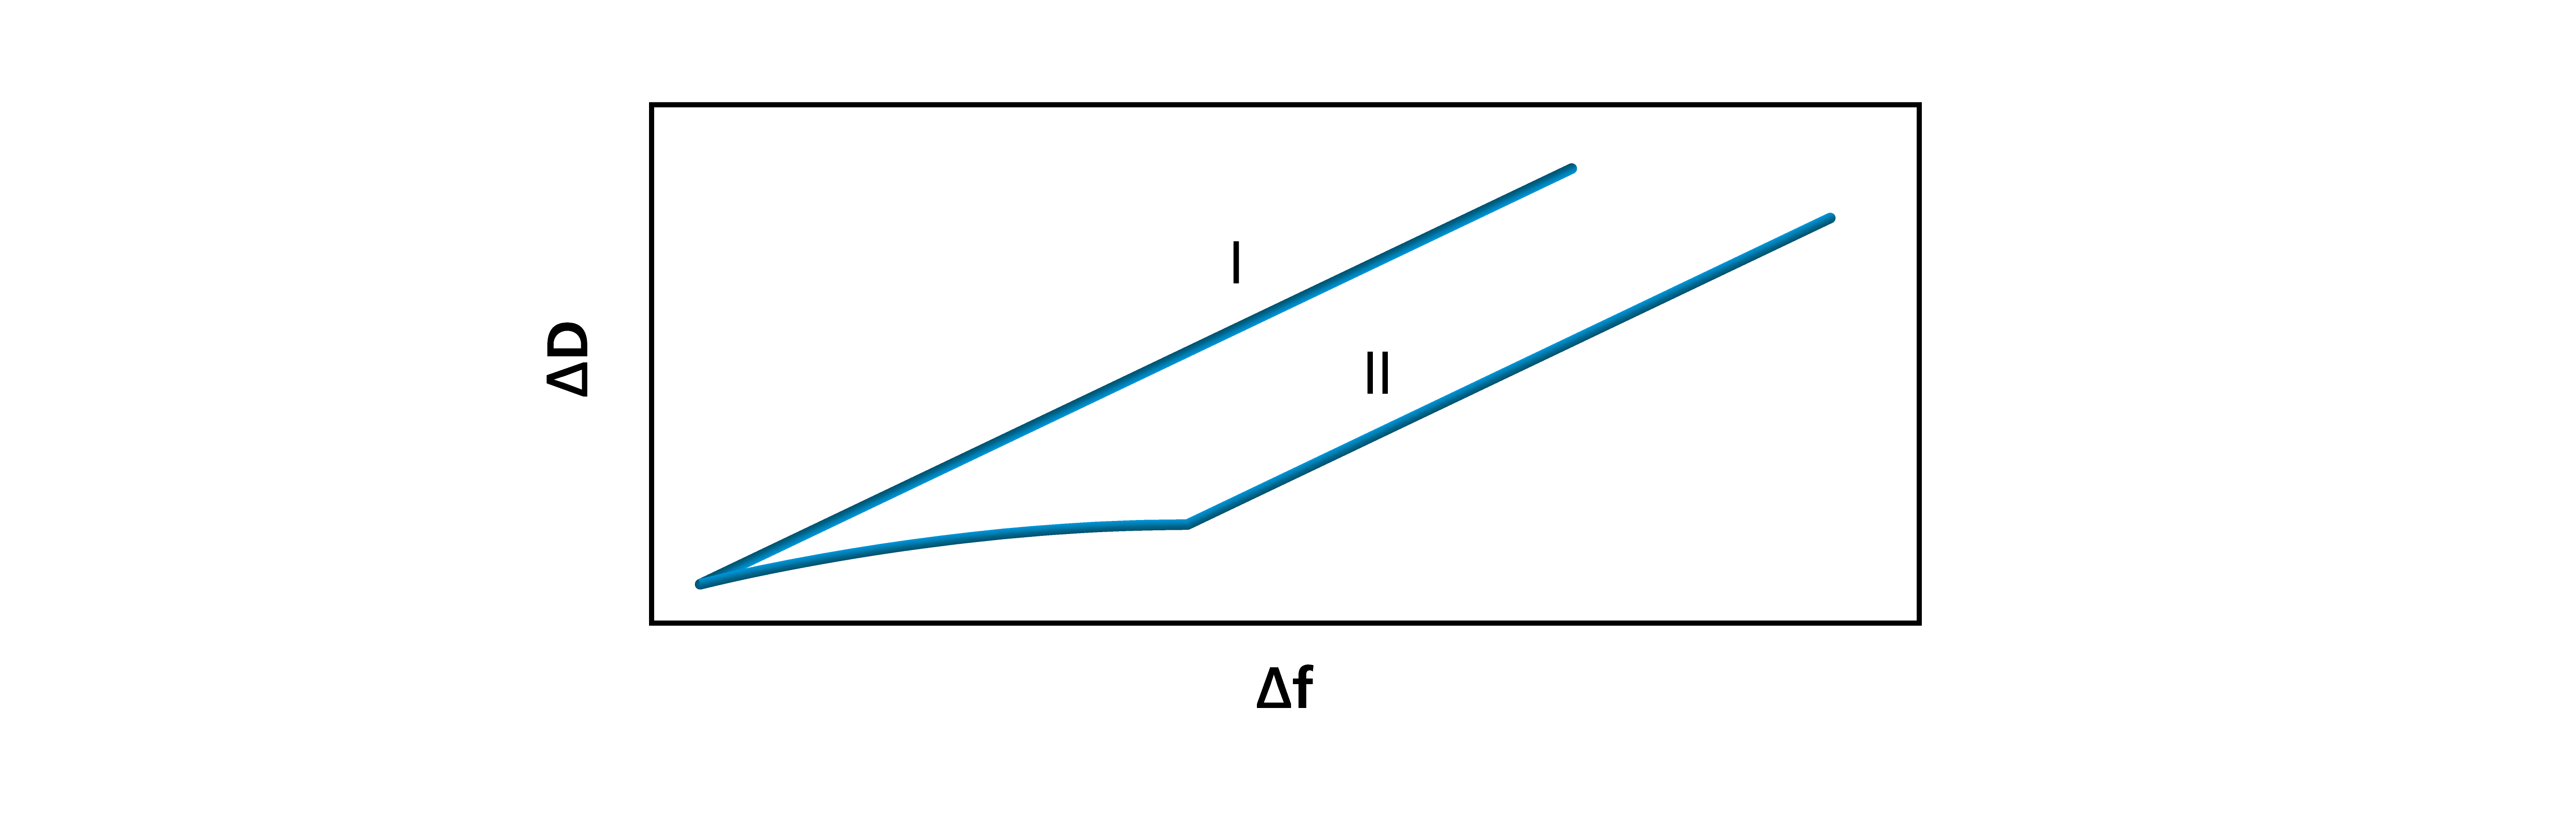
Figure 5. Plotting the raw data as ΔD vs Δf, it is possible to detect phase changes in for example the adsorption. The top curve (I) shows one single phase, while the bottom curve (II) shows two distinct phases.
The mass sensed by the QCM is the mass of all the molecules moving with the oscillating sensor surface. This means that you will not only sense the mass of the molecules coupled to the surface, but you will also sense the liquid which is trapped in between, and associated with, the molecules. Therefore, you can indirectly follow the level of hydration and changes caused of the hydration. As a schematic example, picture elongated molecules adsorbing either flat on a surface or standing up. If they adsorb flat on a surface, very little liquid will be coupled to the molecules. However, if they adsorb standing up, lots of liquid will be coupled, and the layer at the surface will be highly hydrated, Fig. 6.
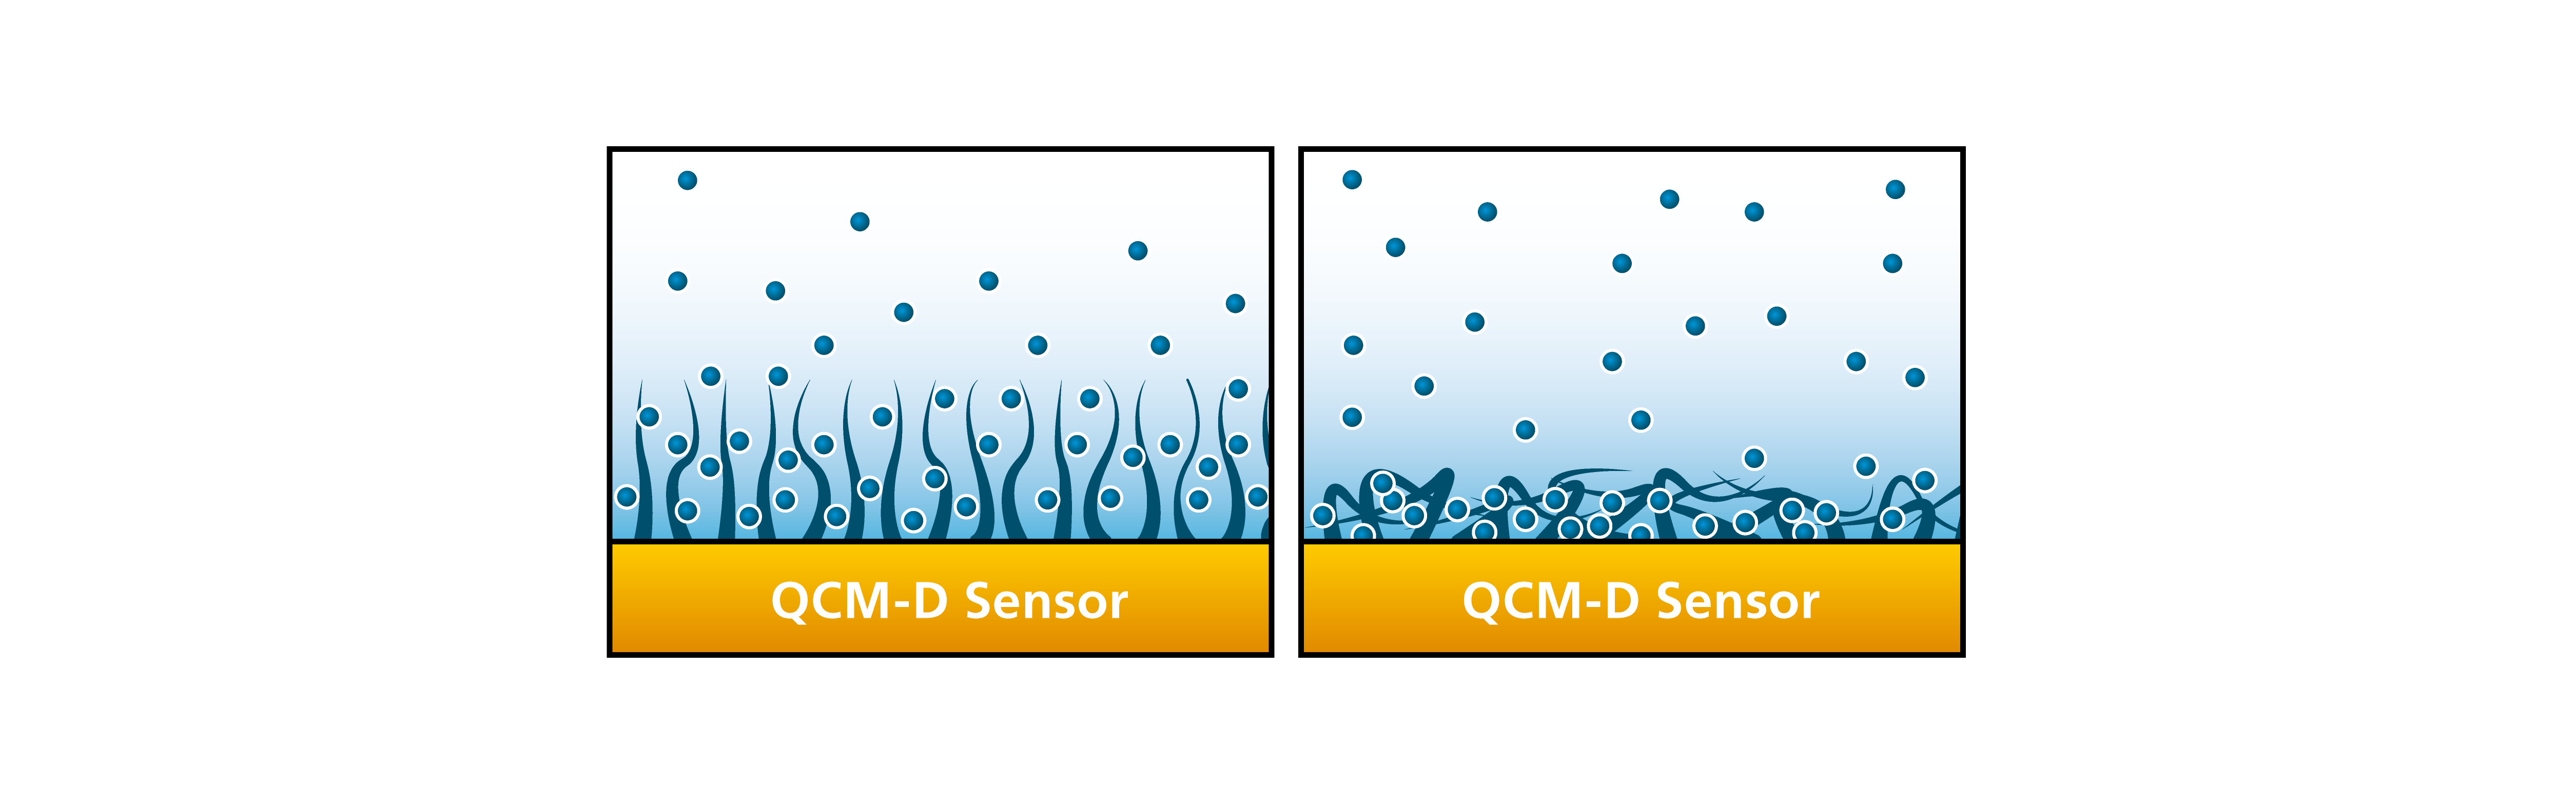
Figure 6. Schematic illustrations comparing a layer which is hydrated (left) compared with one which is not (right).
Combining the information of layer thickness and layer softness, you can follow for example layer swelling. An example would be where you start with a layer that is thin and rigid, but which will then take up liquid and swells with time, Fig. 7.
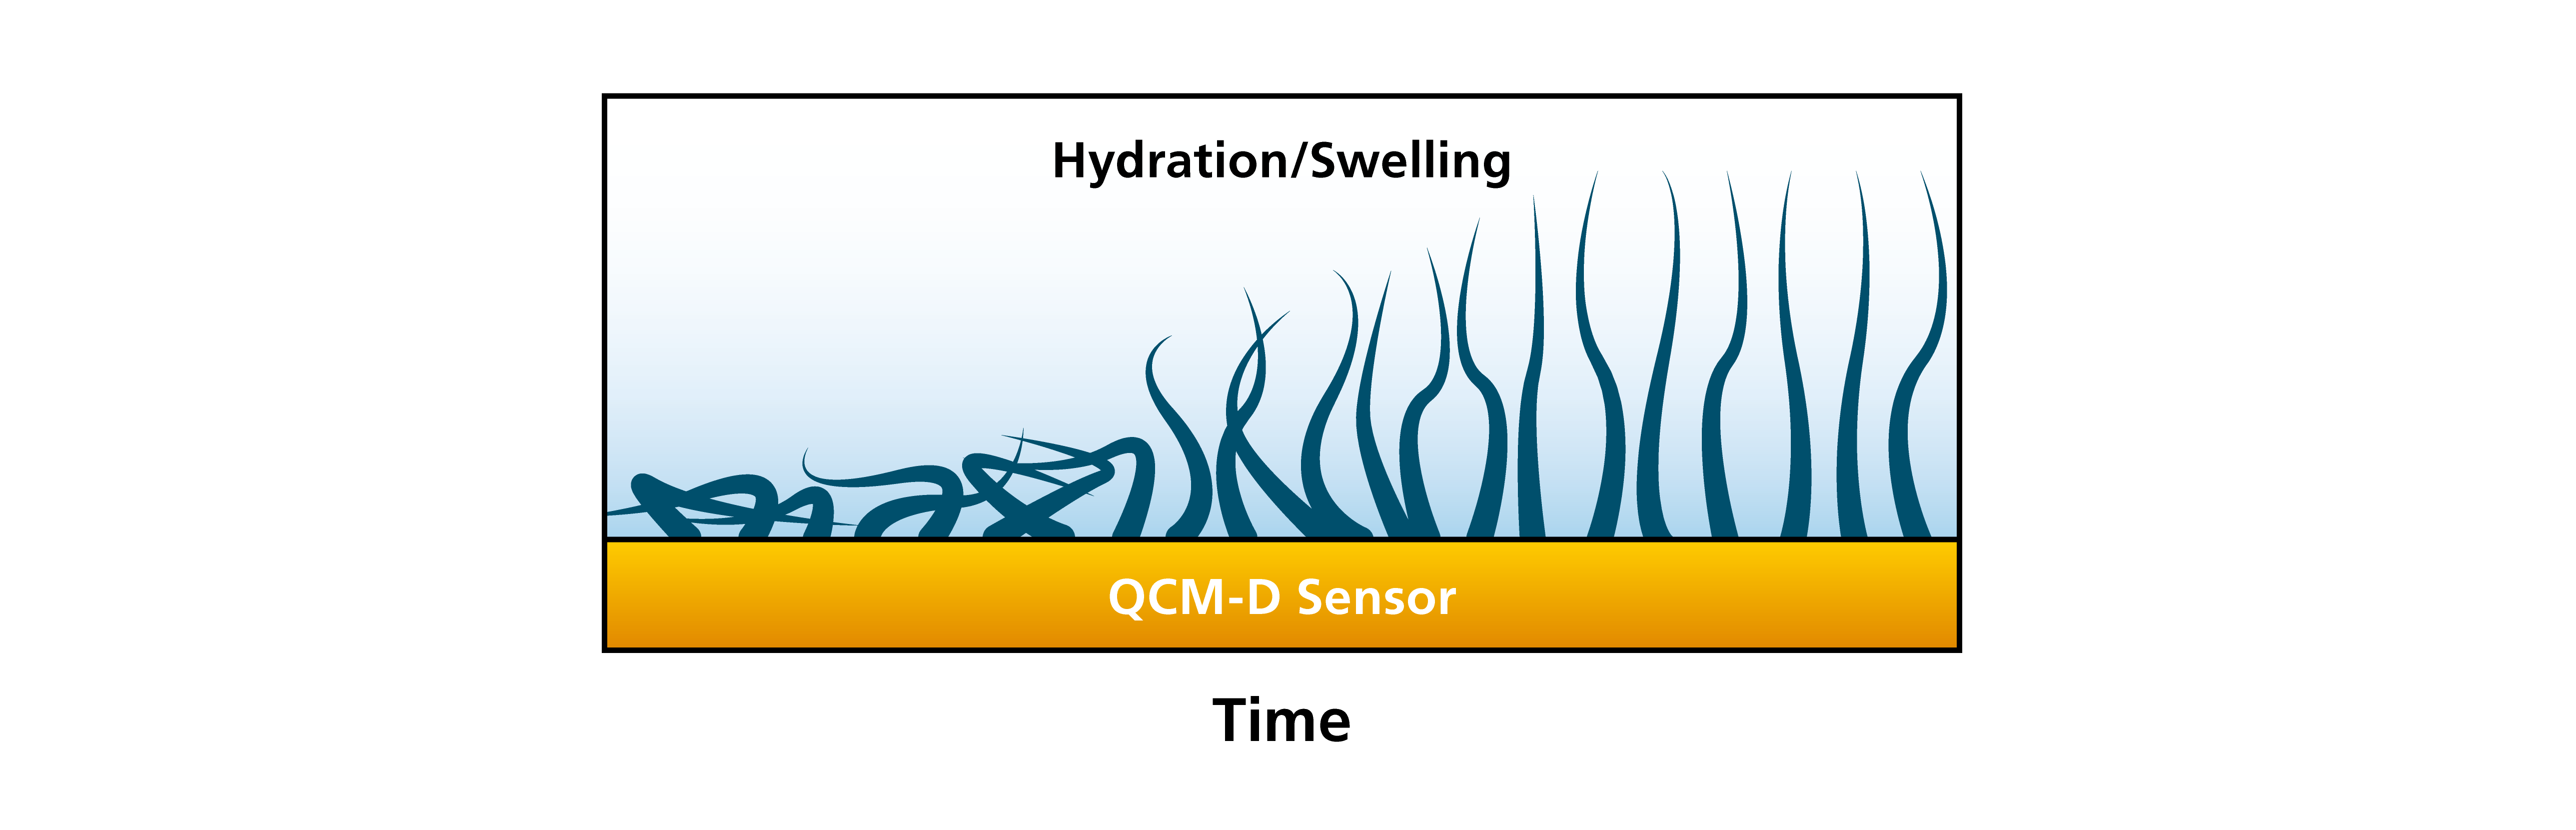
Figure 7. Moving from left to right, this schematic illustration shows a thin and rigid layer, which then swells and turns in to a thick and soft layer.
Combining the information of layer thickness and layer softness we are also able to follow processes where liquid is lost from the film, for example in a film collapse or crosslinking scenario. An example could be where we start with a thick and soft layer that is highly hydrated. Changing the conditions so that the film collapses, for example by changing the salt concentration, pH or temperature, we are able to follow how the film turns more rigid and how the thickness decreases, Fig. 8.
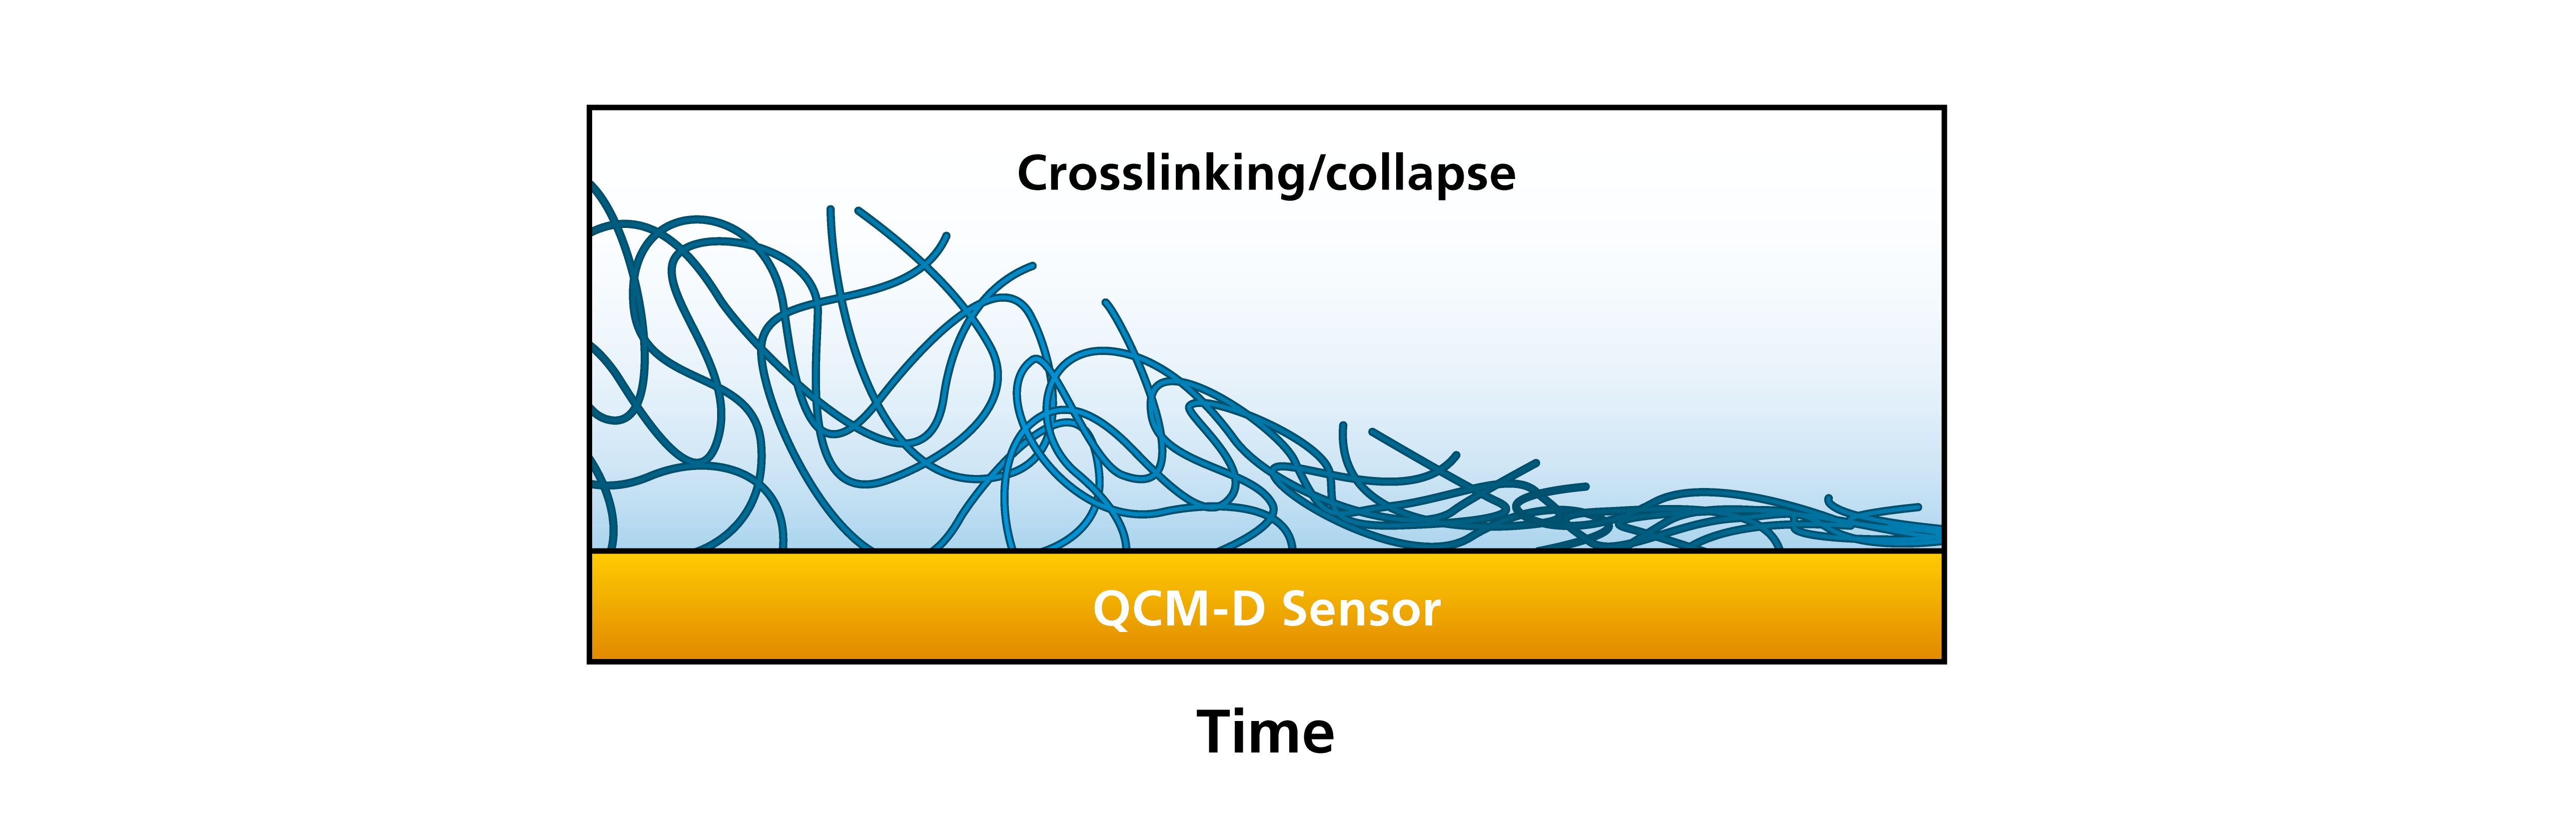
Figure 8. Moving from left to right, this schematic illustration shows a thick and soft layer, which then collapses and turns into a thin and rigid layer.
Here we have shown that the information that you can extract from the QCM-D data is not only mass, but also thickness, softness and how these change over time. Combined, this information enables both the analysis and characterization of surface interaction and reaction processes as well as layer the layer properties. The possibility to follow dynamic processes such as film formation, film degradation, and structural rearrangements enables the exploration as well as characterization and optimization of nanoscale systems including for example biomolecules, polymers, surfactants and nanoparticles.
Download the overview to read more about what information you can extract from QCM-D analysis.

Malin graduated in engineering physics in 2006, where her research focused on the QCM-D technology. Since then, she has been scrutinizing the how’s and why’s of the world in general, and the world of QCM-D in particular.