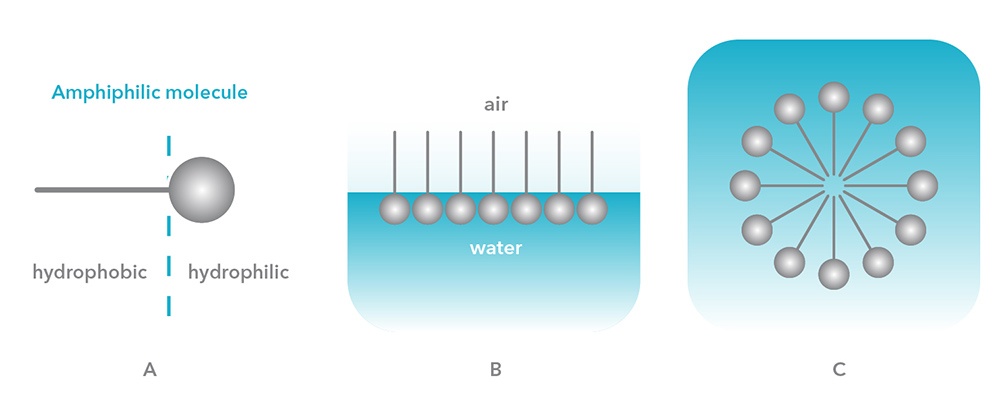
Certain molecules have two distinct components with differing affinity for solutes. The part of the molecule that has an affinity for polar solutes, such as water, is said to be hydrophilic. The part of the molecule that has an affinity for non-polar solutes, such as hydrocarbons, is said to be hydrophobic. Molecules with hydrophilic and hydrophobic components are said to be amphiphilic (Figure A).

Amphiphilic molecules display distinct behavior when interacting with water. The polar part of the molecule seeks to interact with water while the non-polar part shuns interaction with water. There are two ways in which such molecules achieve both these states. An amphiphilic molecule can arrange itself on the surface of water so that the polar part interacts with the water and the non-polar part is held above the surface (either in the air or in a non-polar liquid) as shown in Figure B. The presence of these molecules on the surface disrupts the cohesive energy at the surface and thus lowers the surface tension. Such molecules are called ‘surface active’ molecules or surfactants.
Another arrangement for the molecules allows each component to interact with its favored environment. Molecules can form aggregates or micelles in which the hydrophobic portions are oriented within the cluster and the hydrophilic portions are exposed to the solvent. An example of a spherical micelle is shown in Figure C.
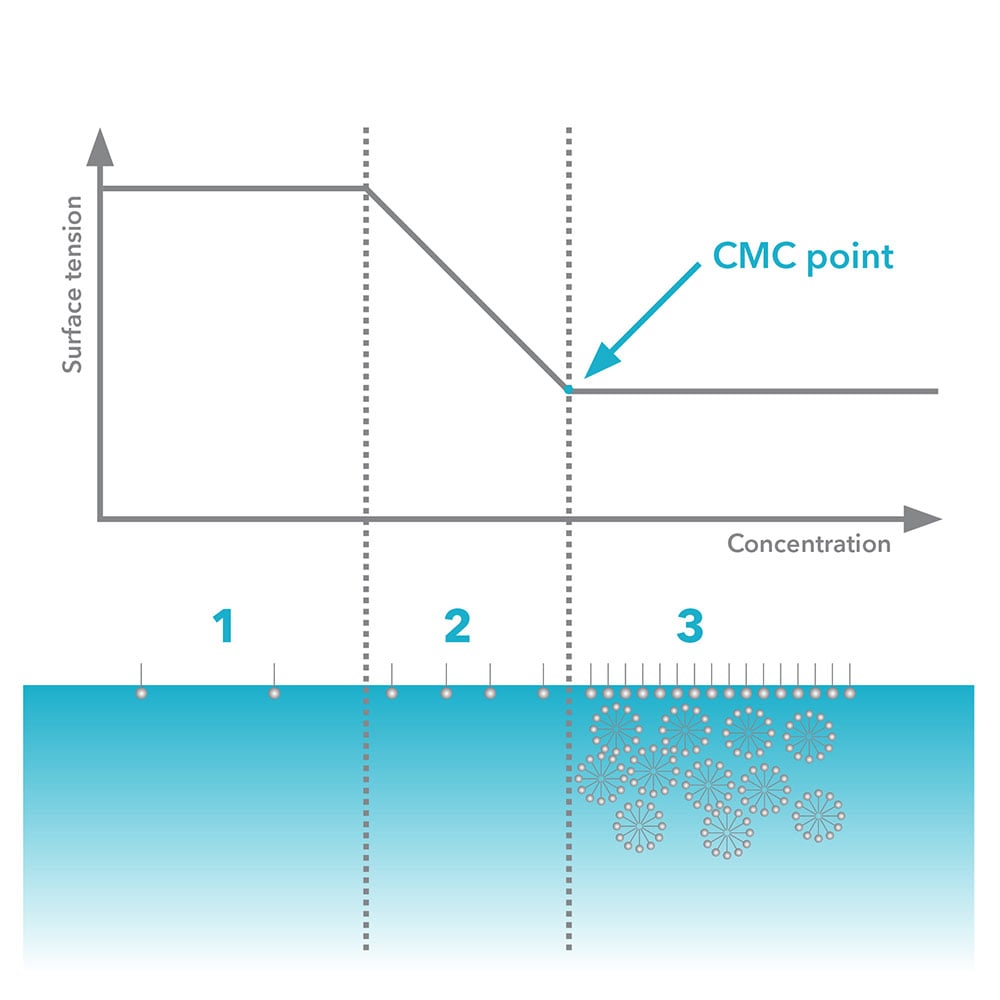
The proportion of molecules present at the surface of a liquid or as micelles in the bulk of a liquid depends on their concentration. At low concentrations, surfactants in low concentrations occupy the surface of the liquid. As the surface becomes crowded with surfactant, additional molecules arrange into micelles. This concentration is called the Critical Micelle Concentration (CMC) and can be found by measuring surface tension. The graph below shows surface tension versus log of concentration of surfactant added:

The graph shows the three phases: 1, at low concentrations of surfactant only a slight change in surface tension is detected; 2, additional surfactant decreases surface tension; and 3, the surface becomes fully loaded, with no further change in surface tension.
CMC is found as the point where the baseline of minimal surface tension and the slope where surface tension shows linear decline intersect. Surface tension versus log concentration may be plotted by measuring a series of manually mixed solutions, or automatically using an Attension Sigma with an optional dispenser. Manual mixing and testing surface tensions for a series of solutions is both time-consuming and may present real problems. By using the automated features of the Sigma range the stability of surface tension measurements can be easily handled. The Sigma 700 and 701 programs also automate the mixing concentrations for even spacing across the log scale and assist with graphics to help find CMC.


